How is PEAKD doing these days? The project is around for a long time now and has been developing a lot of things on Hive. Some of them DHF funded. PEAKD has established itself as the most used frontend on the Hive blockchain. The team around it has been involved in the ecosystem for a long time and they have continuously built and updating it.
The team is also working on a Peak Open project that is funded from the DHF and have more tools for the ecosystem.
Let’s take a look at some of the data.

Here we will take a look at the activity on the platform, the overall number of posts and comments, and the number of users. The top content creators for the last 30 days will be presented as well.
The period that we will be looking at is from April 2020 till March 2024.
Posts
First let us see the number of posts coming from the PeakD.
Here is the chart.
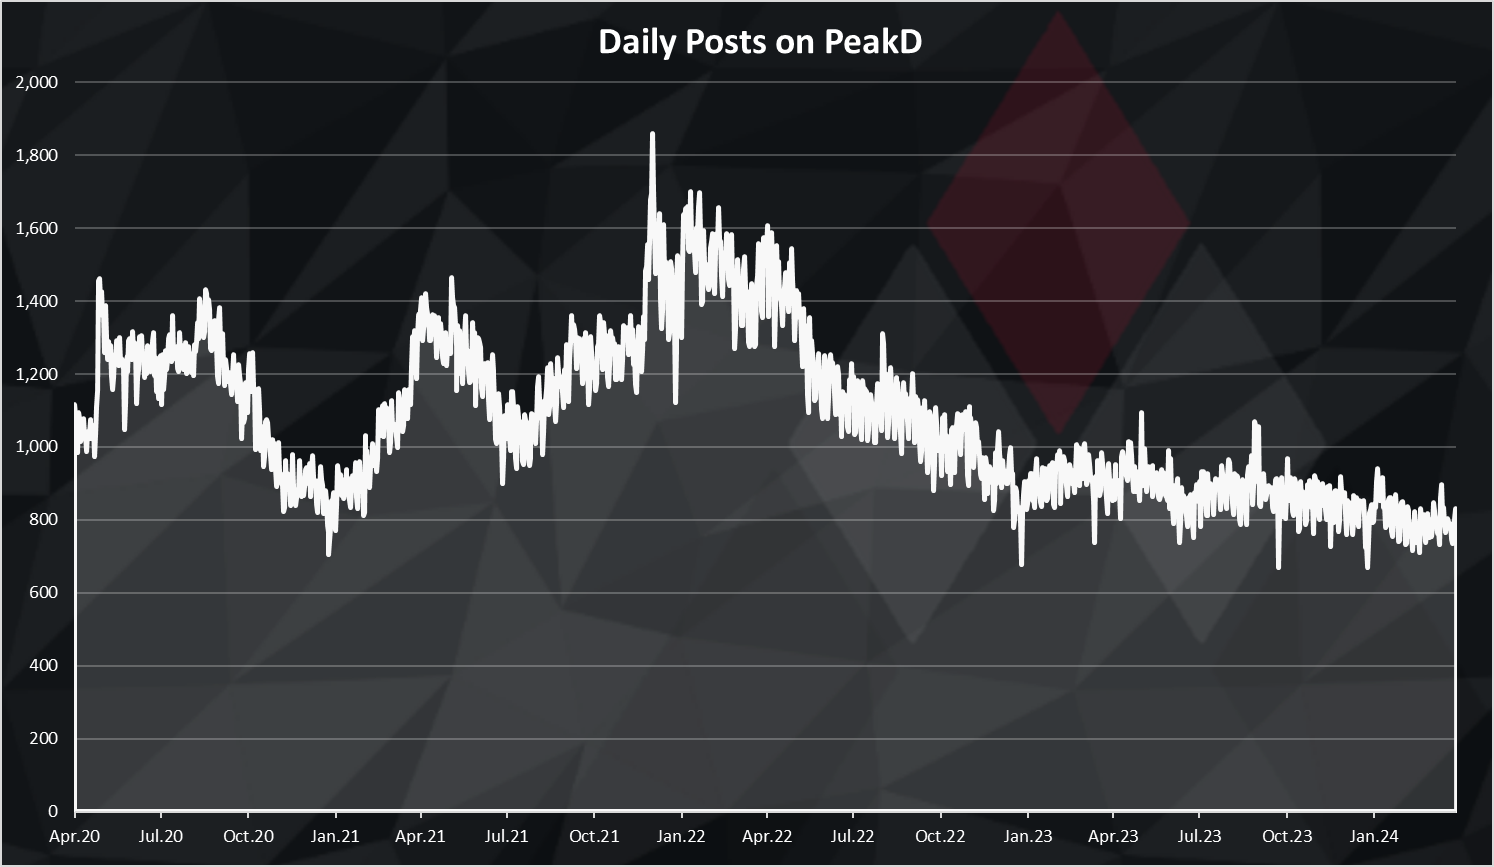
Some ups and downs here. At the beginning in 2020 there was around 1200 post per day, then this number increase to around 1600 in the bull market in 2021-2022, and a slow drop afterwards to around 900 post.
In 2023 and 2024 the numbers have been quite constant in the range of 800 to 1000 posts daily.
This chart follows the price a lot, just with a smaller volatility.
Comments
The chart above was only about posts.
What about comments?
Here is the number of comments made per day from PeakD.
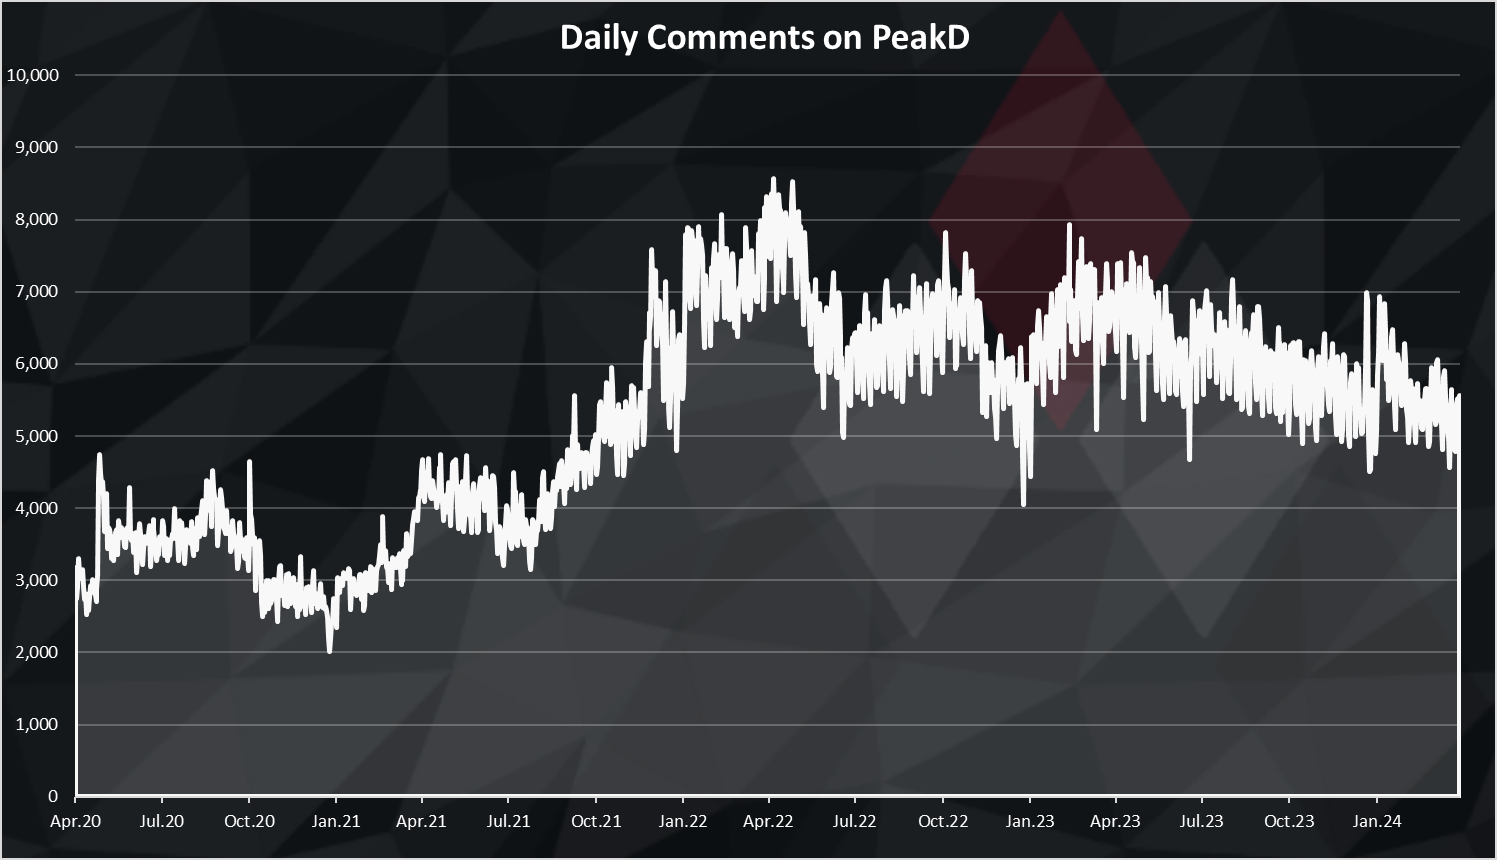
This is qute an interesting chart. The number of comments of has increased trouoghout the years, but have not dropped as the posts are. Users seems more engaged as times progresses and leaving more comments on posts.
The number of comments at first were in the range of 3k to 4k daily in 2020, then increased to 8k in the bull market and stayed just bellow that number around the 7k mark for a long time. There has been some drops to 6k in the last period.
Posts and Comments
When we combine the posts and comments on one chart we get this.
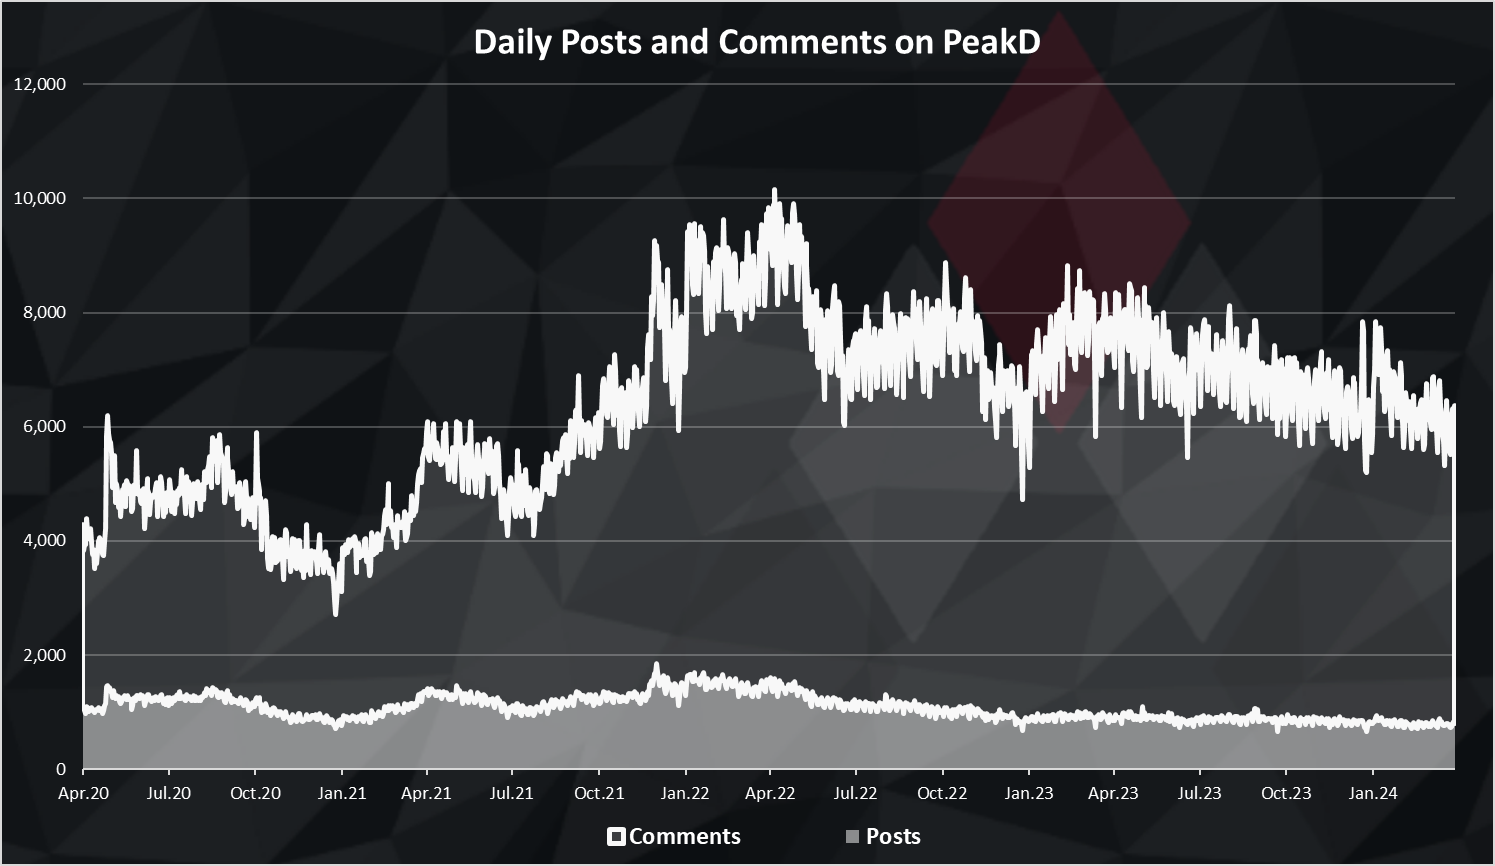
The comments are dominatign the chart as there are more comments than posts. Whats interesting is when we put together the posts and the comments the dowtrend for the chart is smaller when compared to posts only. Post and comments has been in the range of 6k to 8k since June 2022, with a very small downtrend.
When we polot the numbers on a monthly timeframe we get this.
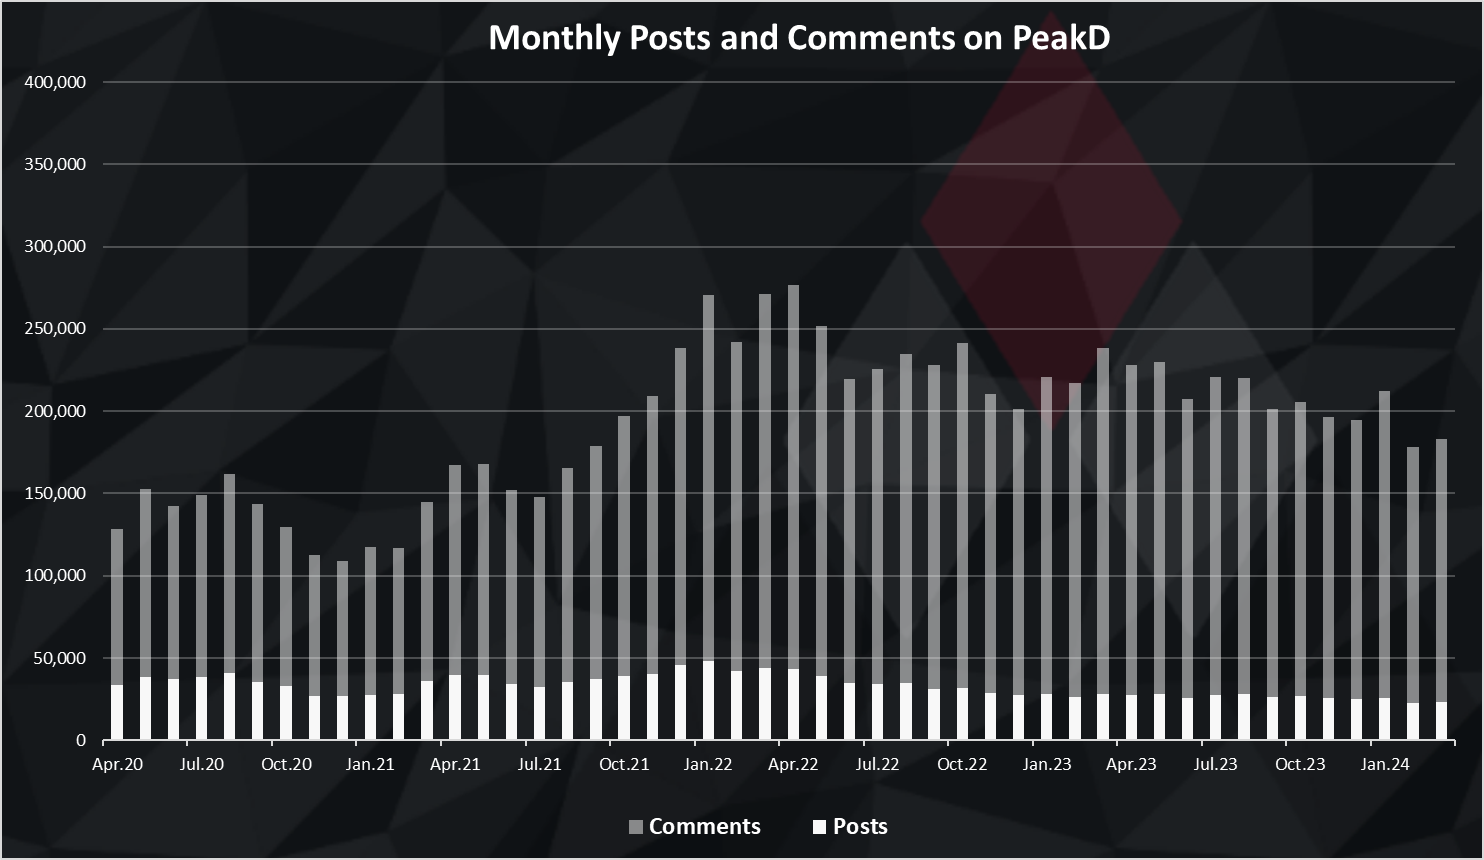
We can see the drop in the summer of 2022, and since then the numbers are almost sideways, with a small drop in the last months. In the recent months, we have around 180k posts comments on a monthly basis.
Active Authors
How about the numbers of the authors on the PeakD. How many accounts are posting?
Here is a chart for the monthly numbers of accounts posting.
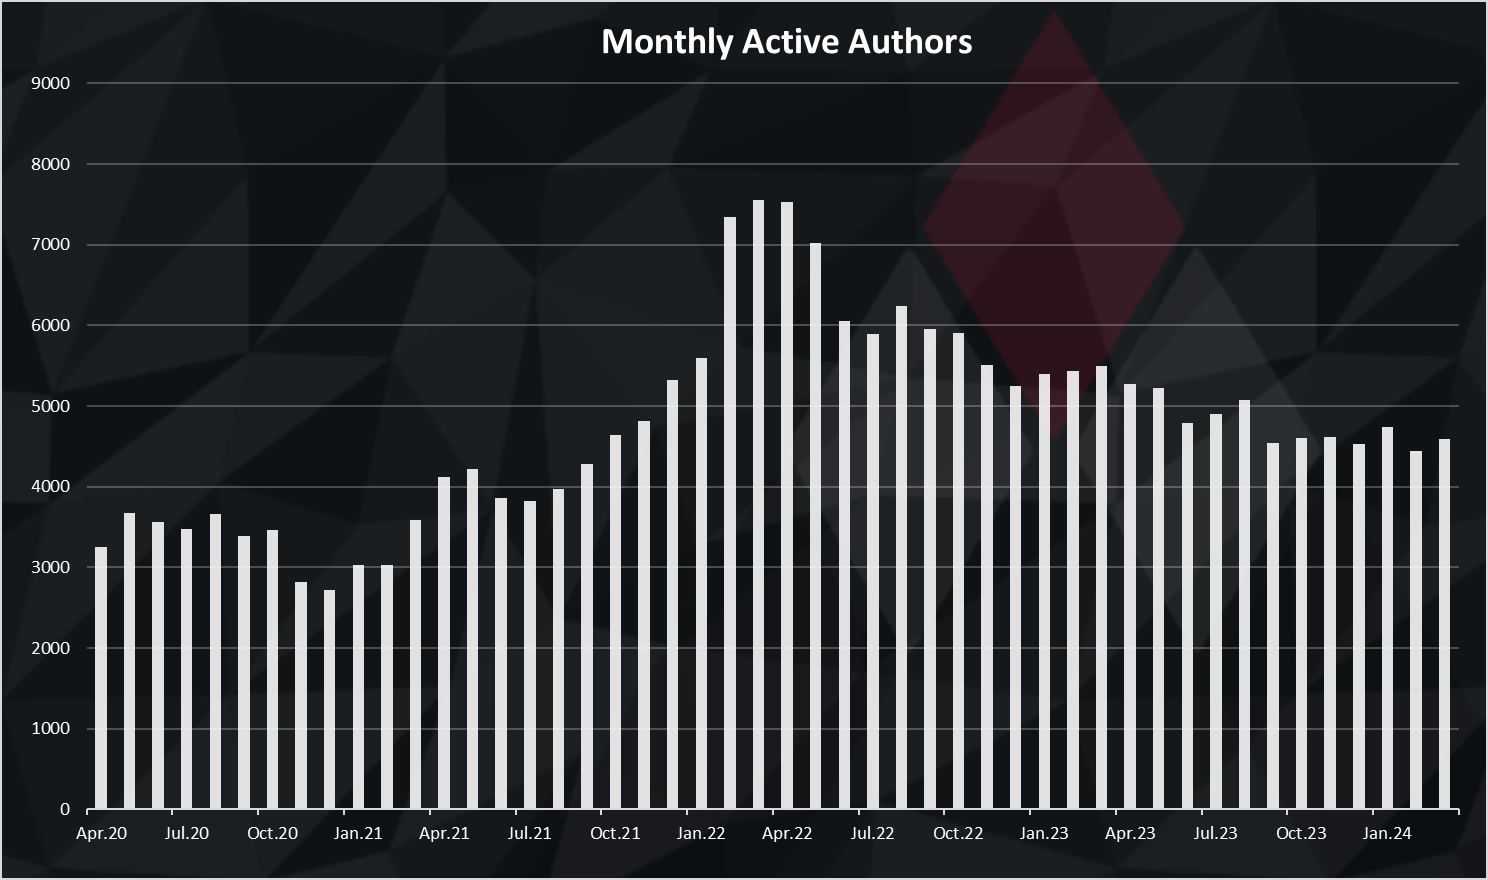
The all-time for MAUs on PeakD was back in April 2022, with 7.5k monthly active users that were making posts and comments. A drop since then, but a small one.
In the recent months as for the posts, we have quite a steady number of MAUs, with around 4.5k monthly active users.
Next the number of unique authors that posted from PeakD. These are authors that posted directly through the frontend.
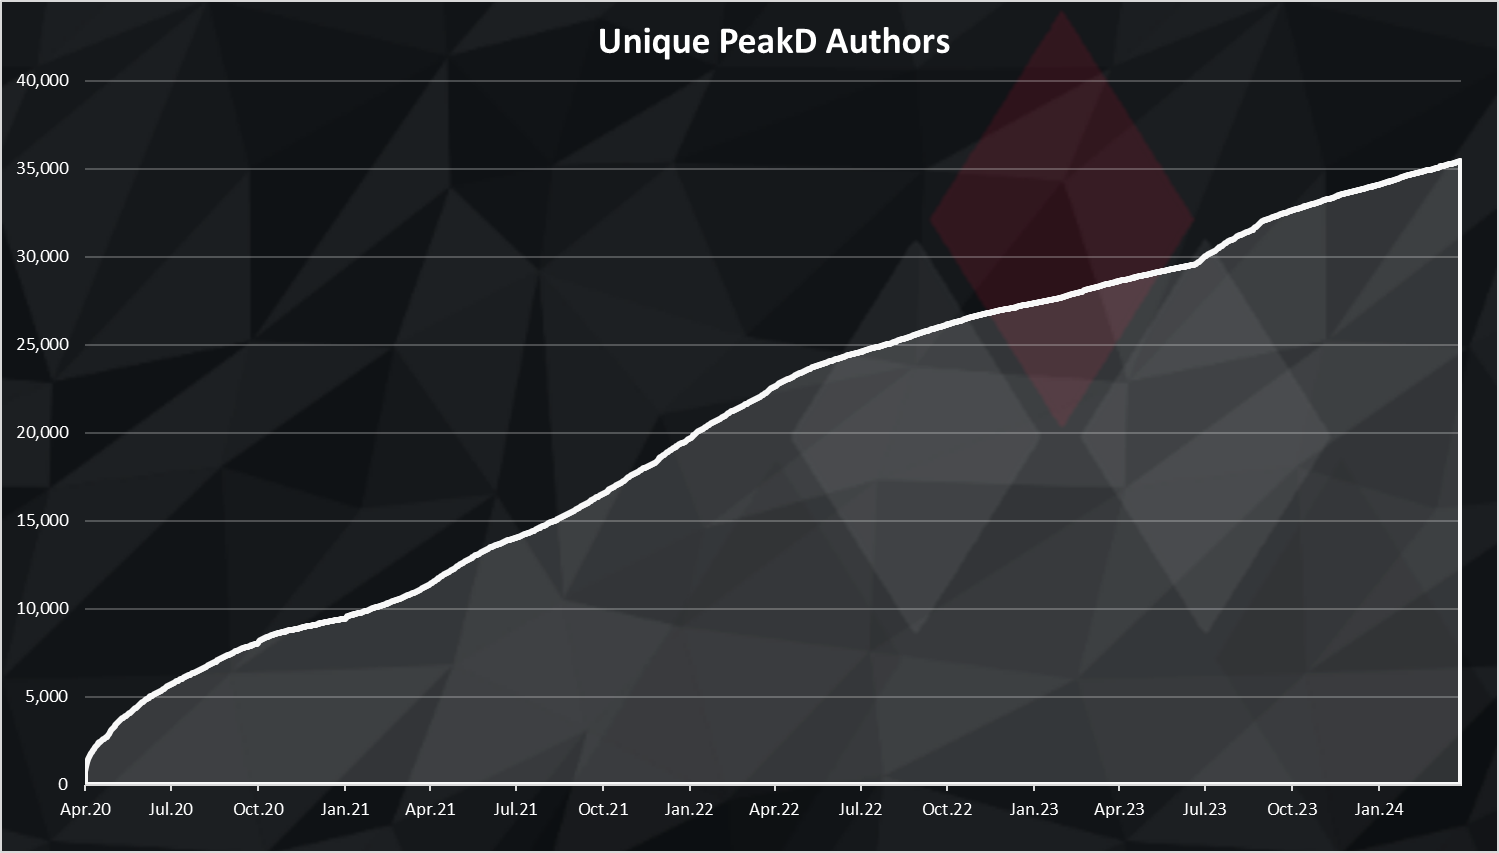
The number of unique PeakD authors is showing continuous growth.
There is a total of 35k unique authors that have used PeakD to post. In the first three months of 2024 a total of 1.5k new accounts have tired PeakD for the first time. In 2023 a total of 7k new accounts used PeakD for the first time.
Authors that Posted the Most
Here is the rank of the authors that posted the most in the last 30 days on PeakD.
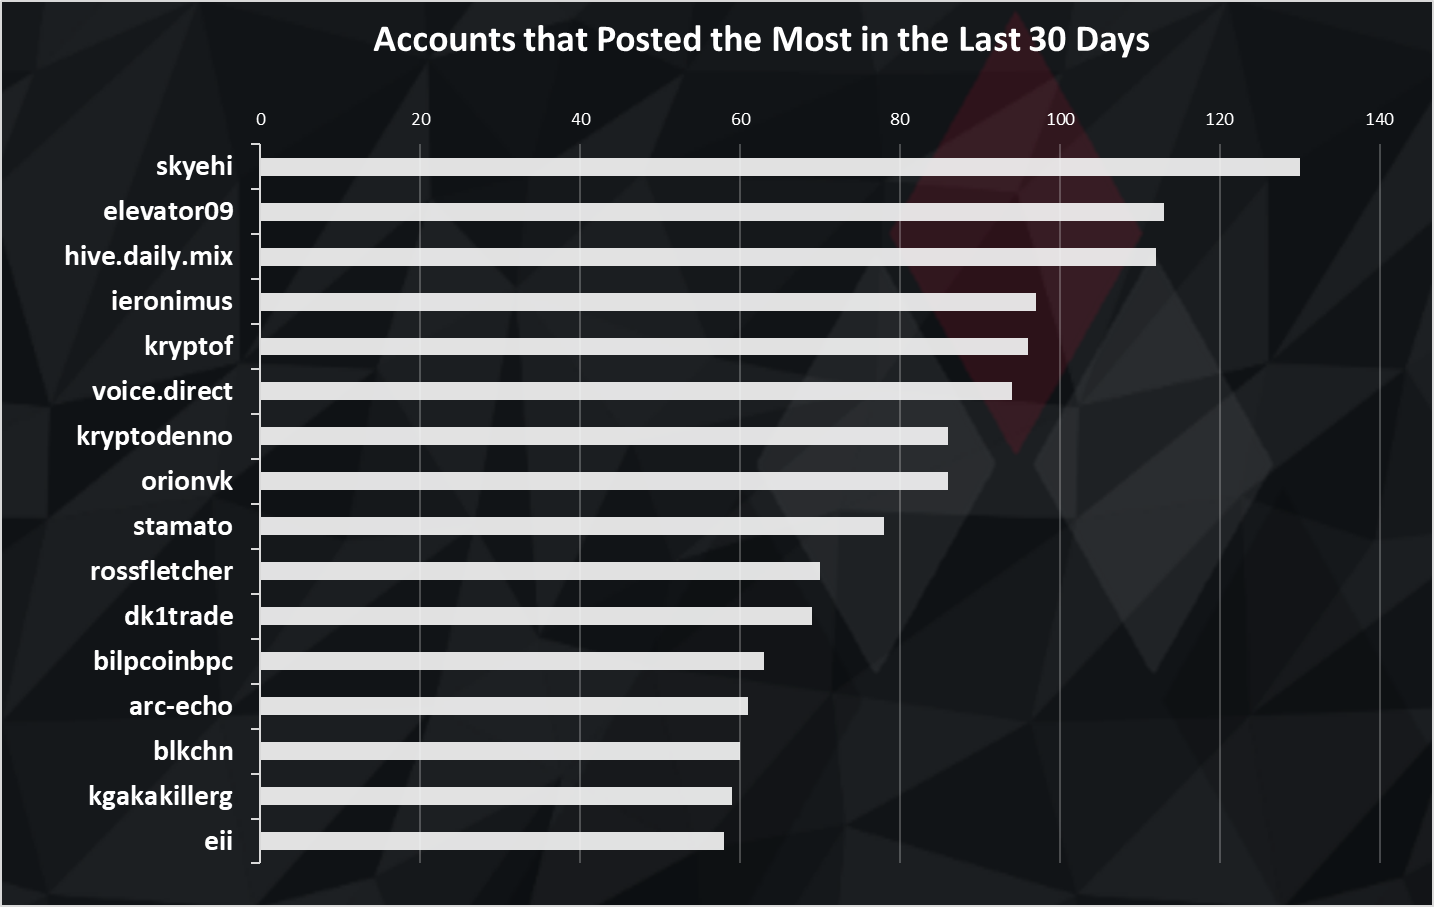
There seems to be some spam accounts at the very top.
There is some community run projects that report daily and some genuine account in the second half of the ranks.
Authors that Commented the Most
Here is the rank of the authors that commented the most in the last 30 days on PeakD.
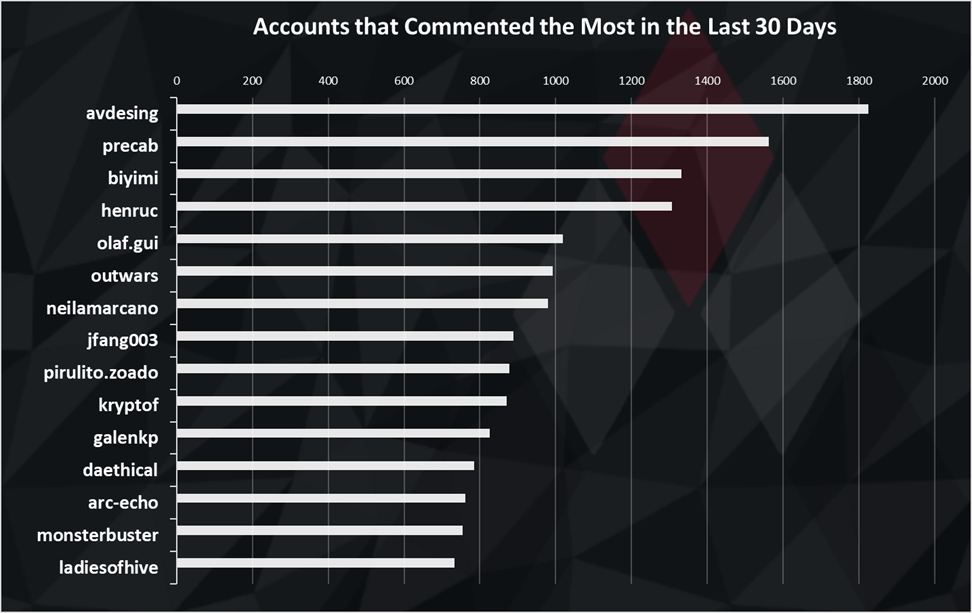
More genuine accounts when it comes to commenting when compared to posting, although some spam as well.
Overall, we can see that there has been a decrease in the activity coming from PeakD, but not as much as the drop in the price. Comments have proven to be more resilient and the drop in the numbers of comments is smaller than the number of posts. The number of authors is also constant in the last period. The small increase in the Hive price haven’t had any significant effect yet.
All the best
@dalz