It has been a long while since last looking at bitcoin dominance. This was something I kept an eye on during the bear market with the thought that it would need to hit the 40% level or possibly even lower before we would see the true bottom.
Well, well, well...
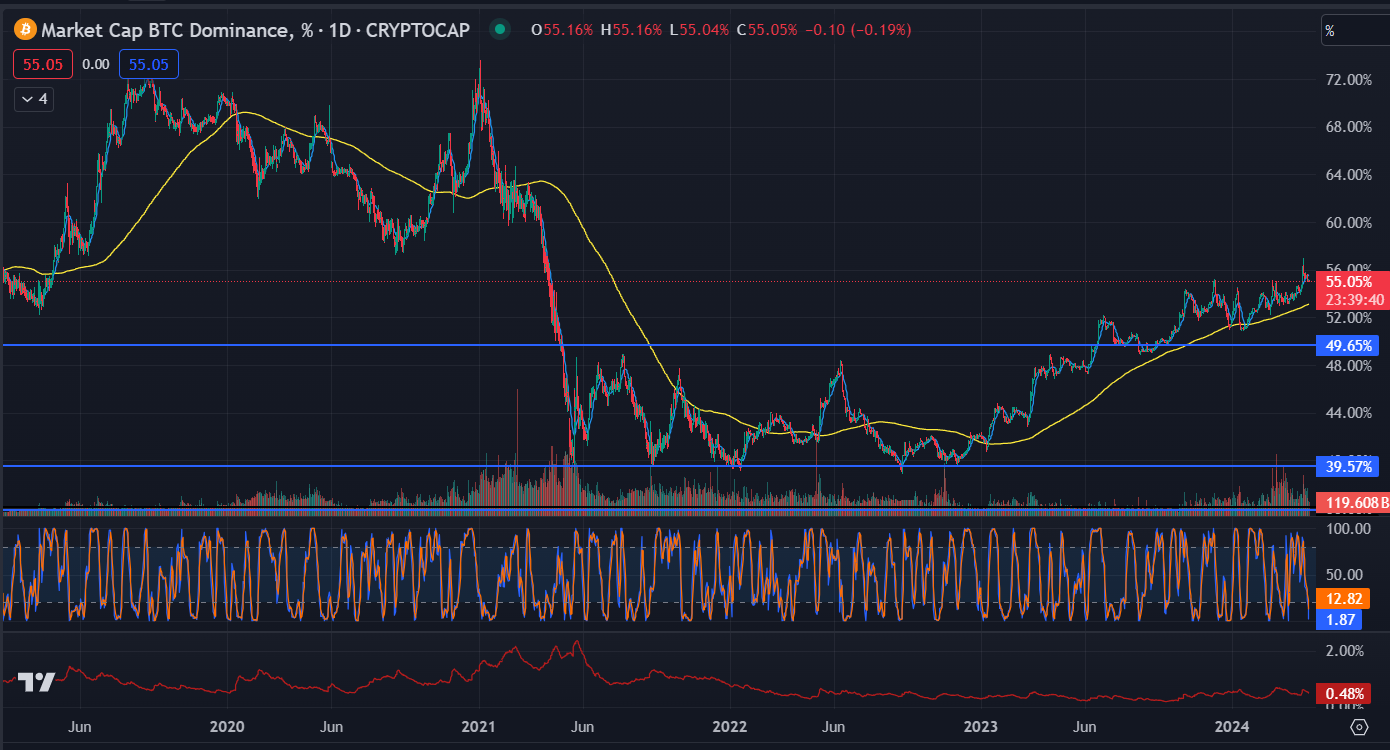
Looking at the BTC dominance chart above you can see that it did indeed test the support level around 40% and then after many instances bouncing off it we finally saw a breach back above the 50% level.
Honestly, I believe that break of 50% was the last time I looked at it (or posted about) it.
Since then we have obviously seen a rise in bitcoin (and crypto for the most part).
Now I see it creeping up toward 60% as it sits at 55%. This has me thinking, the 60% level and break of it was basically the top of the last bull market (give or take) so if we hit again, what does that represnt?
I'm really not sure as we are rising to it rather than dropping from it. We tend to see a drop when the big alt push finally happens, which can often mark the last leg of a bull market.
Maybe we rise to 60% dominance and then a drop back to 50% makes the beginning of a top?
One never knows.
Posted Using InLeo Alpha