We have been seeing a recovery in bitcoin price in recent days. It dropped below $60k, now it's above $60k again. We cannot see very sharp movements in the price, we can say that there is a horizontal trend. There are those who think that the price will move like this for a while. We have seen mostly horizontal movements before the sharp rise. There may be some further retreats. There are also those who think that a retreat to $40-45k would not be a surprise. If there is a pullback this far, there is a great opportunity to buy.
There was a good increase in hive price over the weekend. While the price increased, it did not return to its previous level. In such cases, a new increase occurs after a small retreat. On the first day, we saw an increase to $0.385, followed by a pullback to $0.33. The price rose again to $0.377 with a new increase. When this area could not be exceeded, there was a retreat to $0.308. When this price increase took place, there was an incredible increase in volumes, especially on the first day. The whales did not sell most of the hives they purchased. They will sell the hives at subsequent price increases.
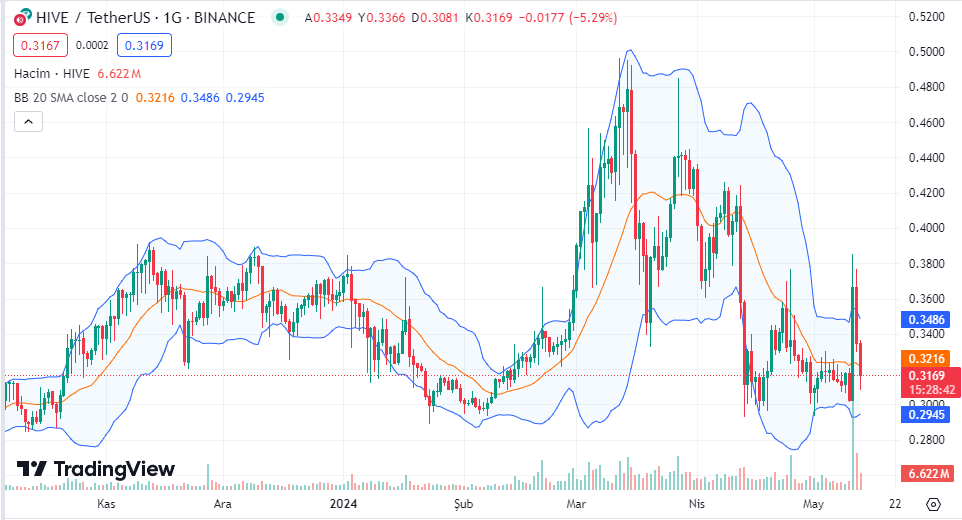
(Tradingview Hive /USDT 1D chart)
Hive price is located in a region between the lower band and the middle band on the Bollinger band. This region is not a very reliable region. For the safe zone, it must rise above the middle band. In the price increase two days ago, even the upper band was exceeded. Since there was a narrowing in the Bollinger band, it became easier to exceed the upper band.
Currently the price is $0.3169. Overcoming this region depends a little on Bitcoin, but it is not difficult. Once this point is exceeded, the next target is the upper band and the price in that region is $0.348. An increase of around 10% is sufficient.