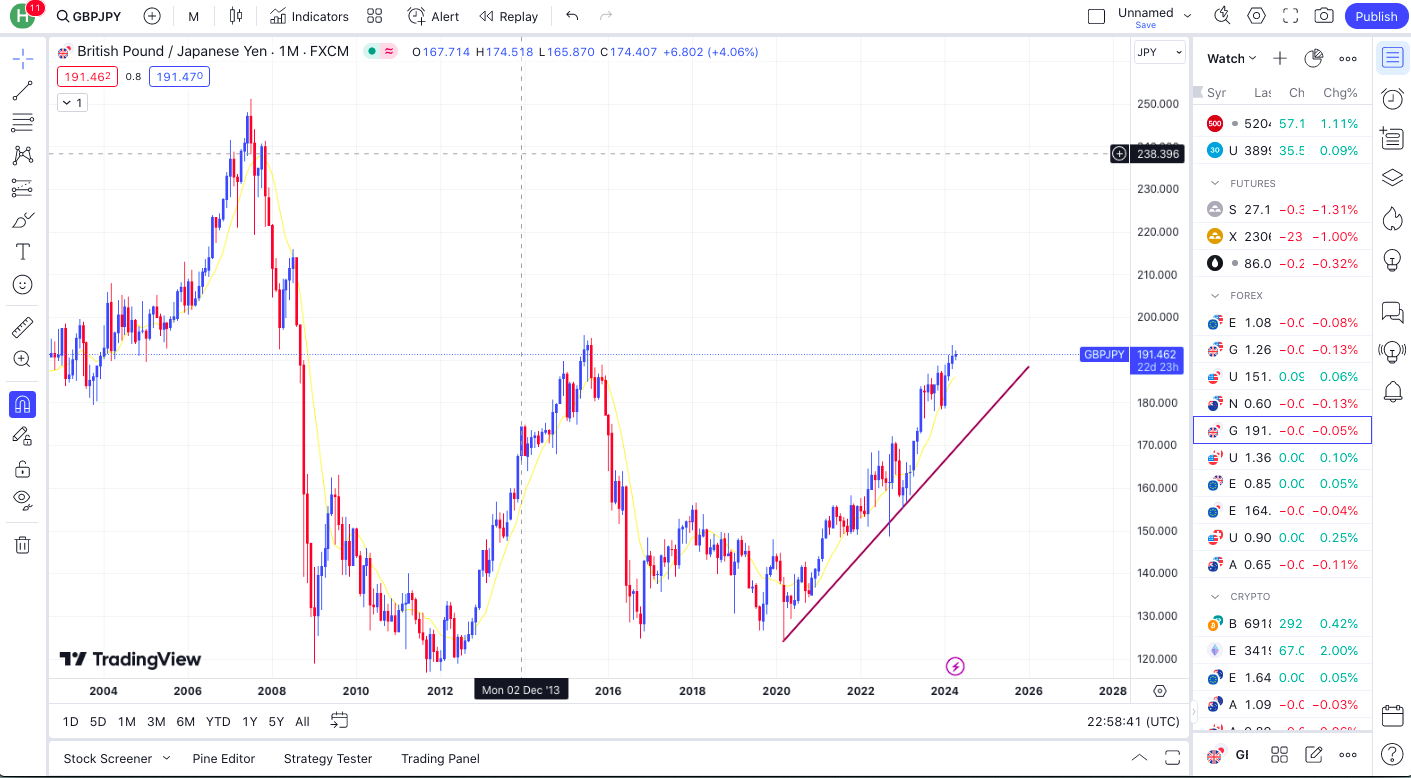
This currency pairs has been bullish since March 2020 this is over two years of being in an uptrend. On this monthly time Frame, it is approaching a resistance at about 195 region. This resistance level that occurred around 2015 is expected to be respected. As we all know that the market does not really go in pattern so we should expect a turn around anytime from now. On a monthly Time frame, we can see that the bullish candles is becoming weaker.
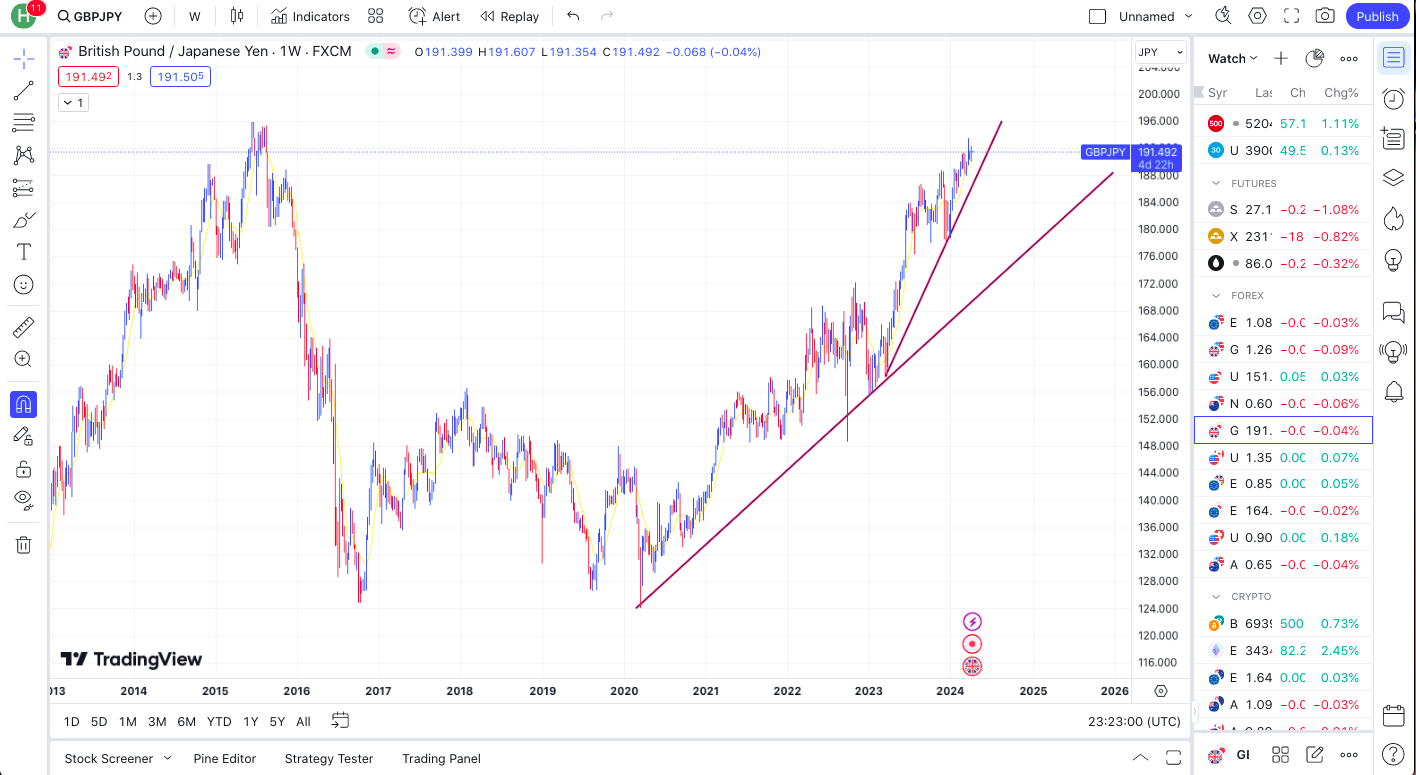
On a weekly Time Frame, I saw a way to draw an inner trend line which differs from the Monthly Time Frame. Aside this inner Trend Line there is not much difference between the monthly time frame and the weekly time frame pattern. So the analysis of the Monthly Time frame still correlate positively with the weekly. Which is a respect of the previous resistance is expected on a technical analysis point of view
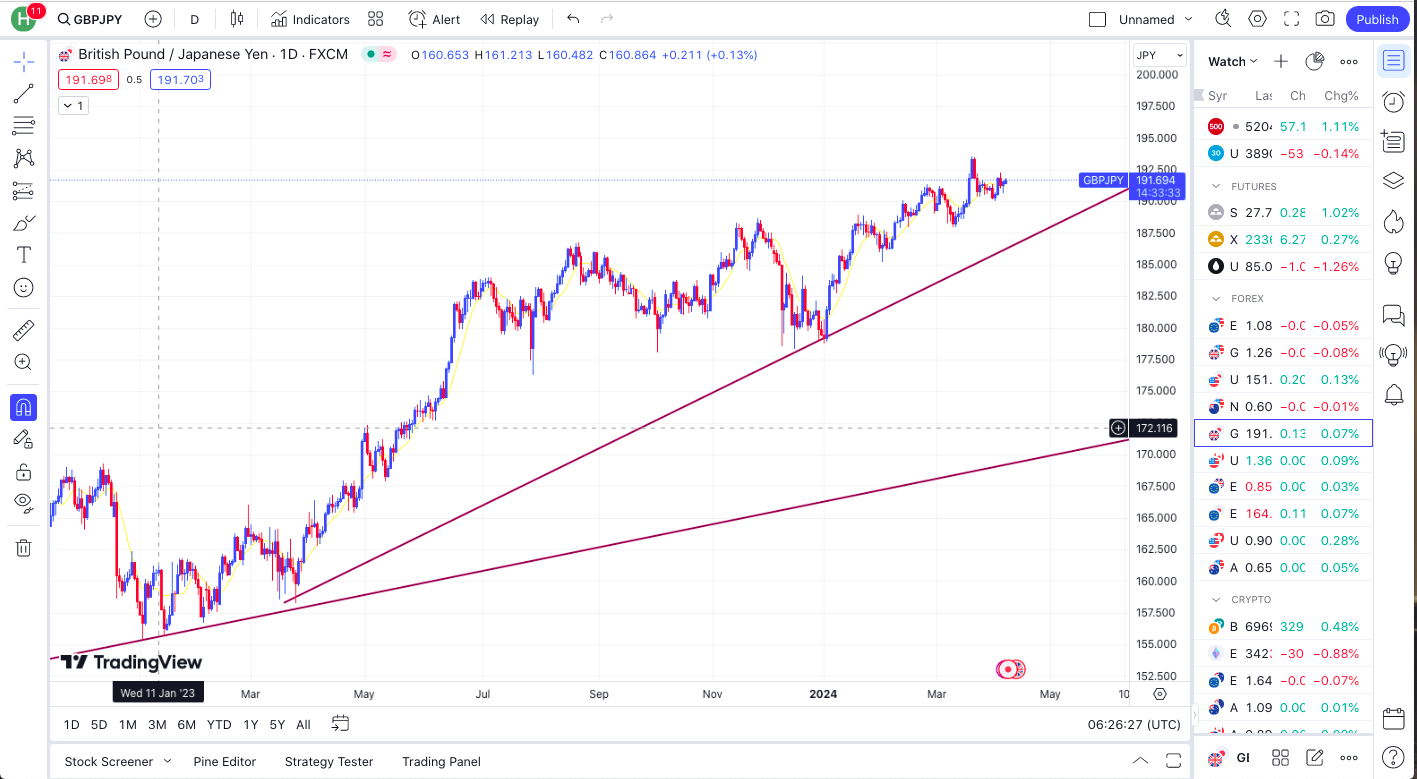
On a daily time frame we can see that this currency pair has given a pattern for another inner trend just as the weekly and the daily. In this obvious analysis not forgetting that we have a resistance that will be respected both on the monthly as well as the weekly Time Frame. I will place a sell stop at 191.351. Which shows that the inner trend line on the daily has been broken.
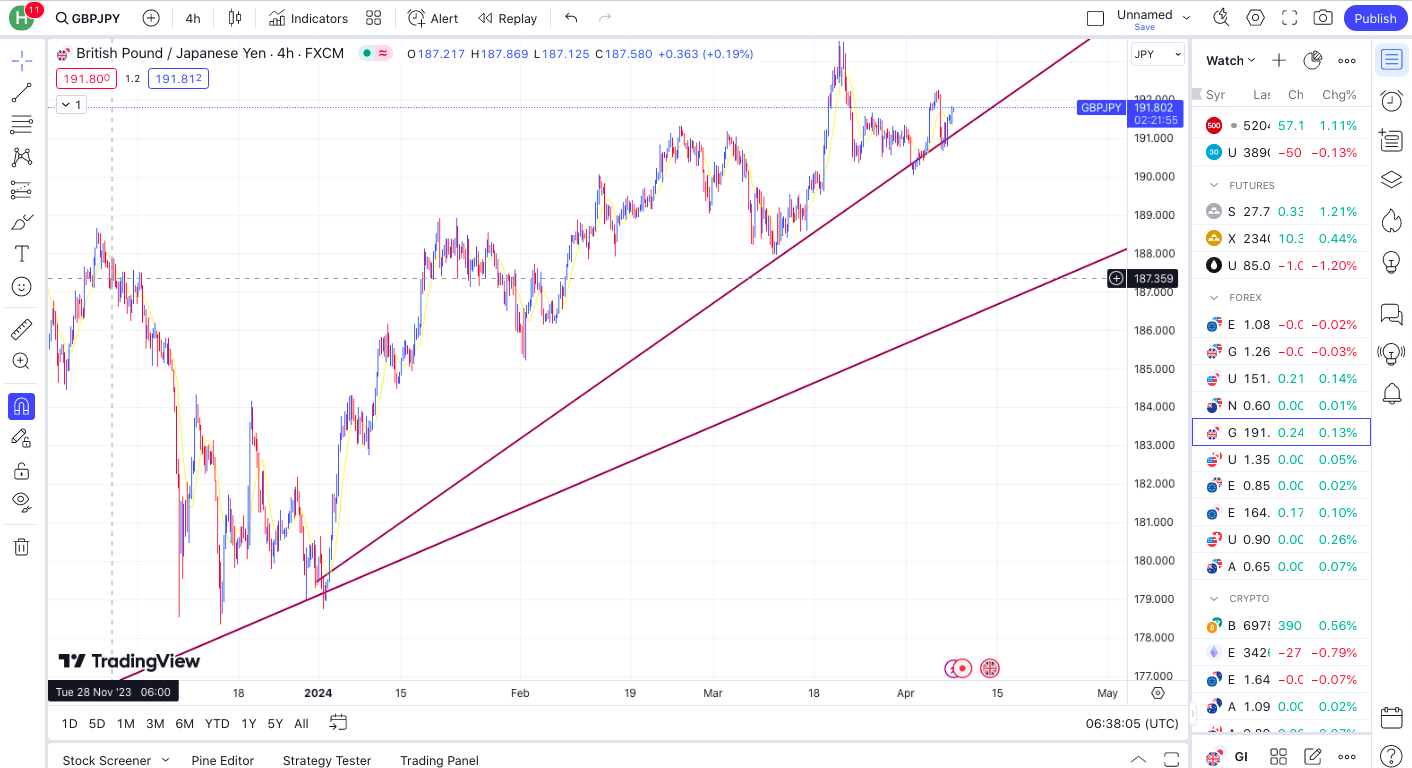
The four hour Time frame correlates with the daily. This increase my confidence of my sell stop. I will be watching out that region as I tend to enter aggressively into this opportunity.
NOTE: Forex Trading is very risky, only invest the money you can lose
NB: This is not a financial advice to take any trade as this is just my view of the market
Posted Using InLeo Alpha