Hello hivers,
Today we will look at some important levels of Solana.
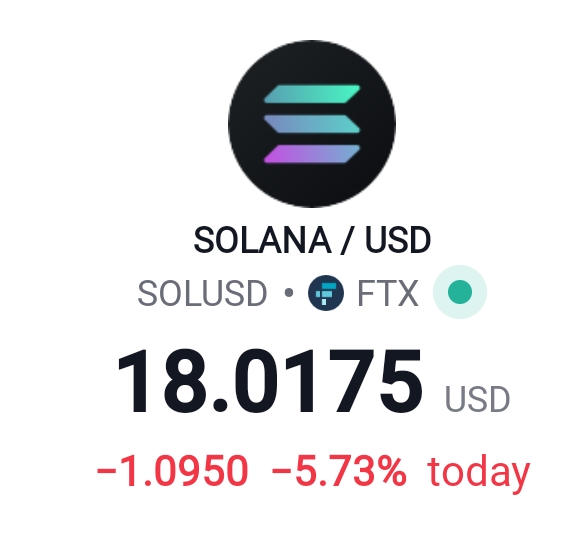
Monthly time frame
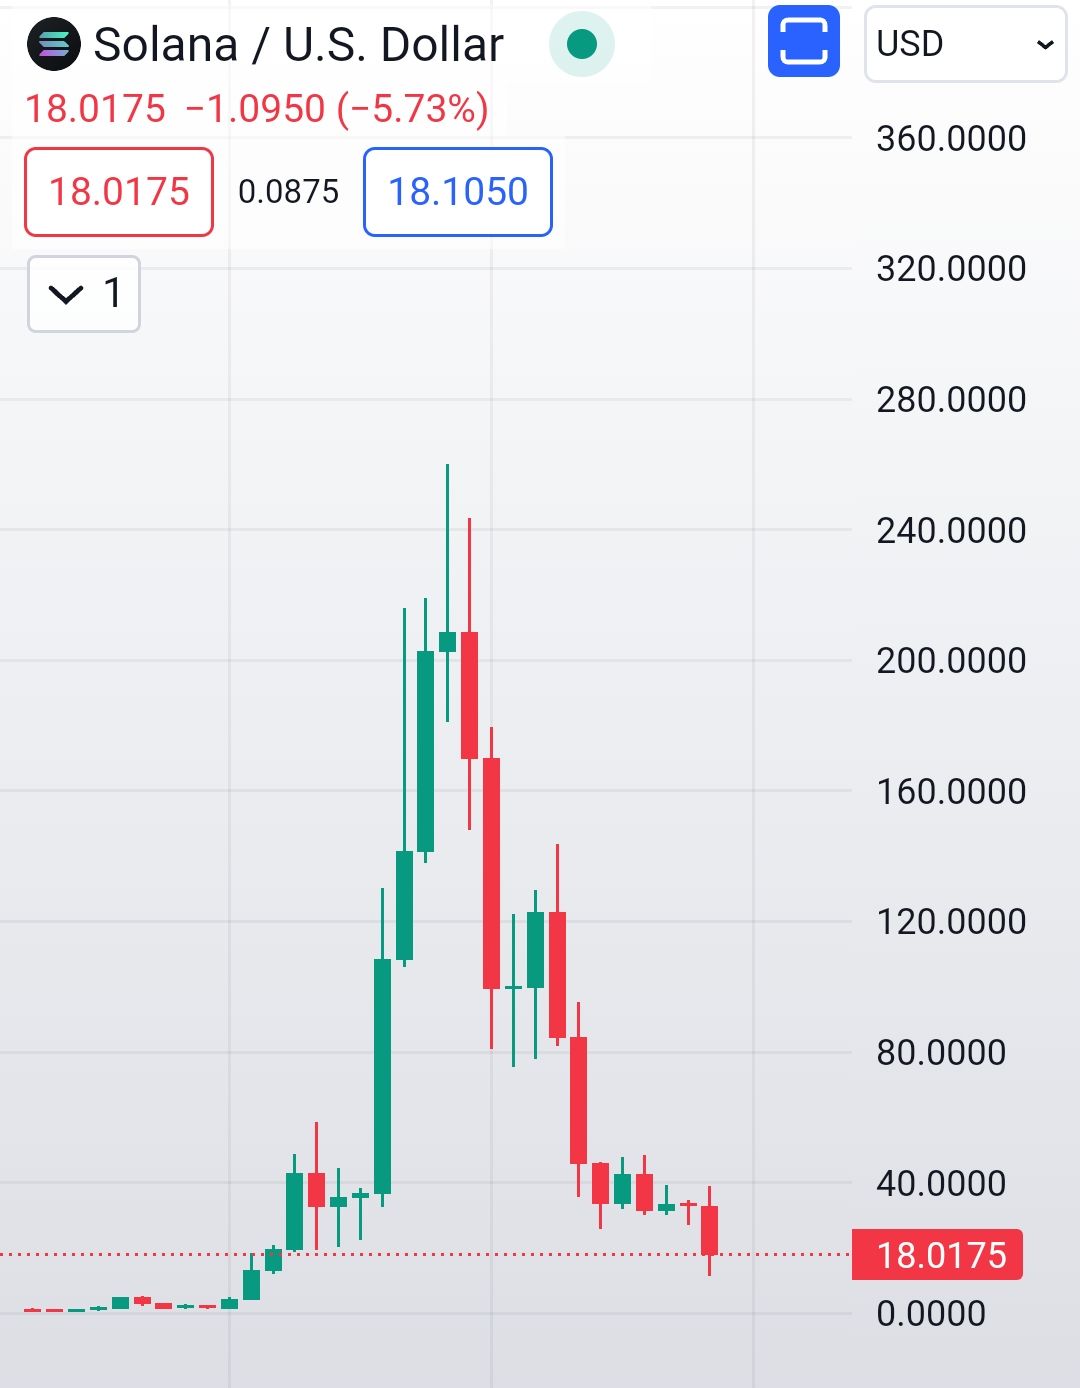
In the monthly timeframe, Solana (SOL) experienced a notable high around $250, but it has since retraced to $18. This substantial decline raises questions about the underlying market dynamics and potential factors influencing the current valuation. Understanding the reasons behind this decrease is crucial for a comprehensive analysis.
Weekly time frame
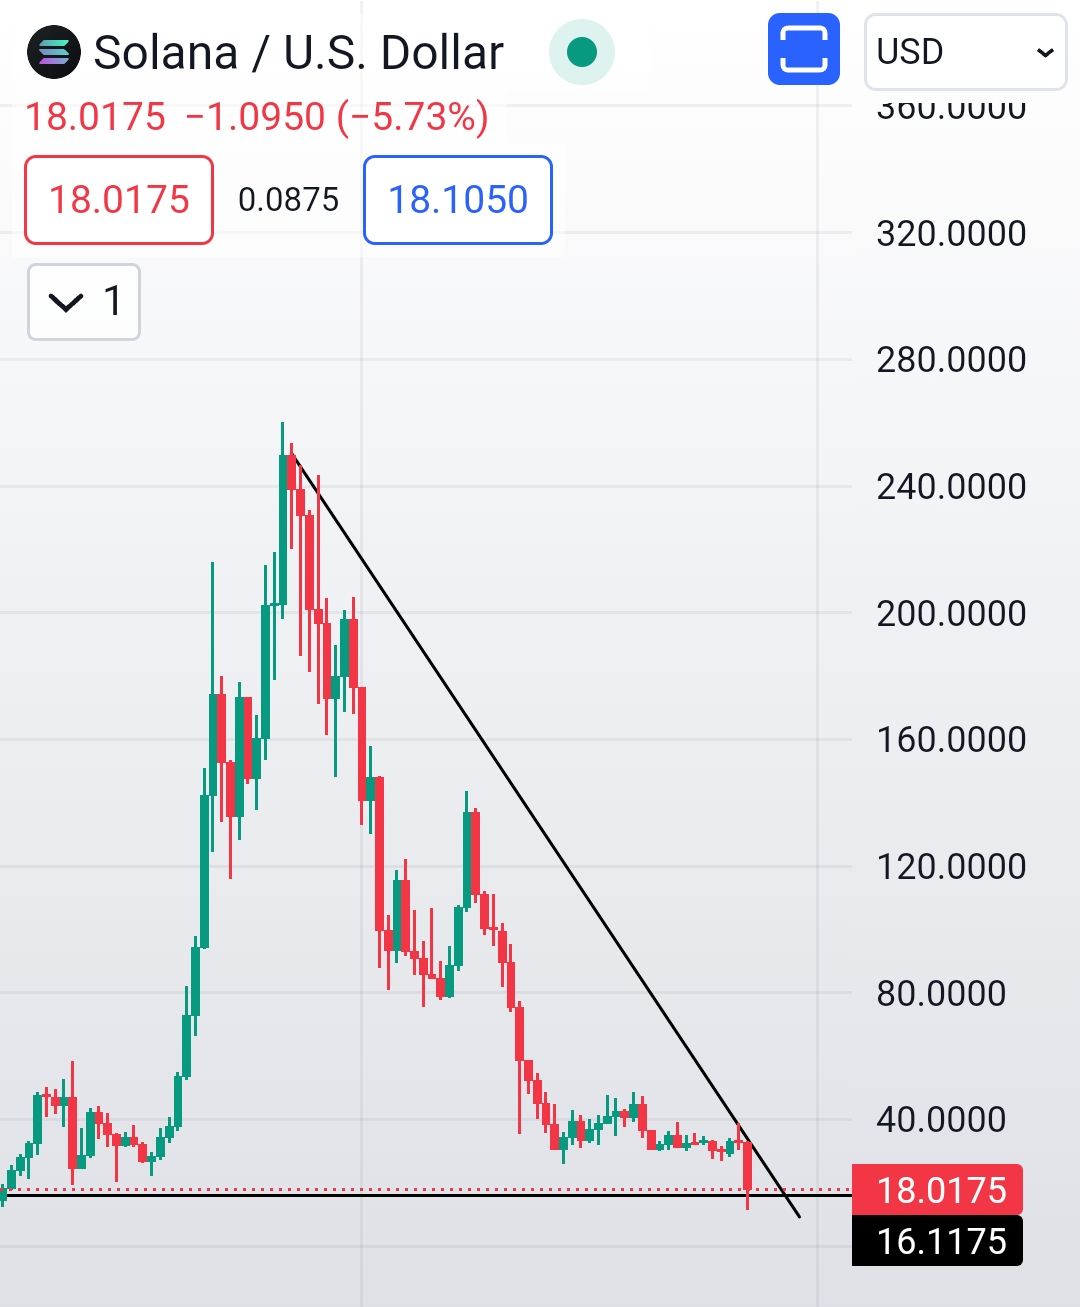
On the weekly chart, Solana is forming a triangular pattern. This consolidation pattern suggests indecision among market participants, often leading to a significant price movement once the pattern resolves. Traders should closely monitor the breakout direction, as it can provide insights into the future trend of Solana.
Daily time frame
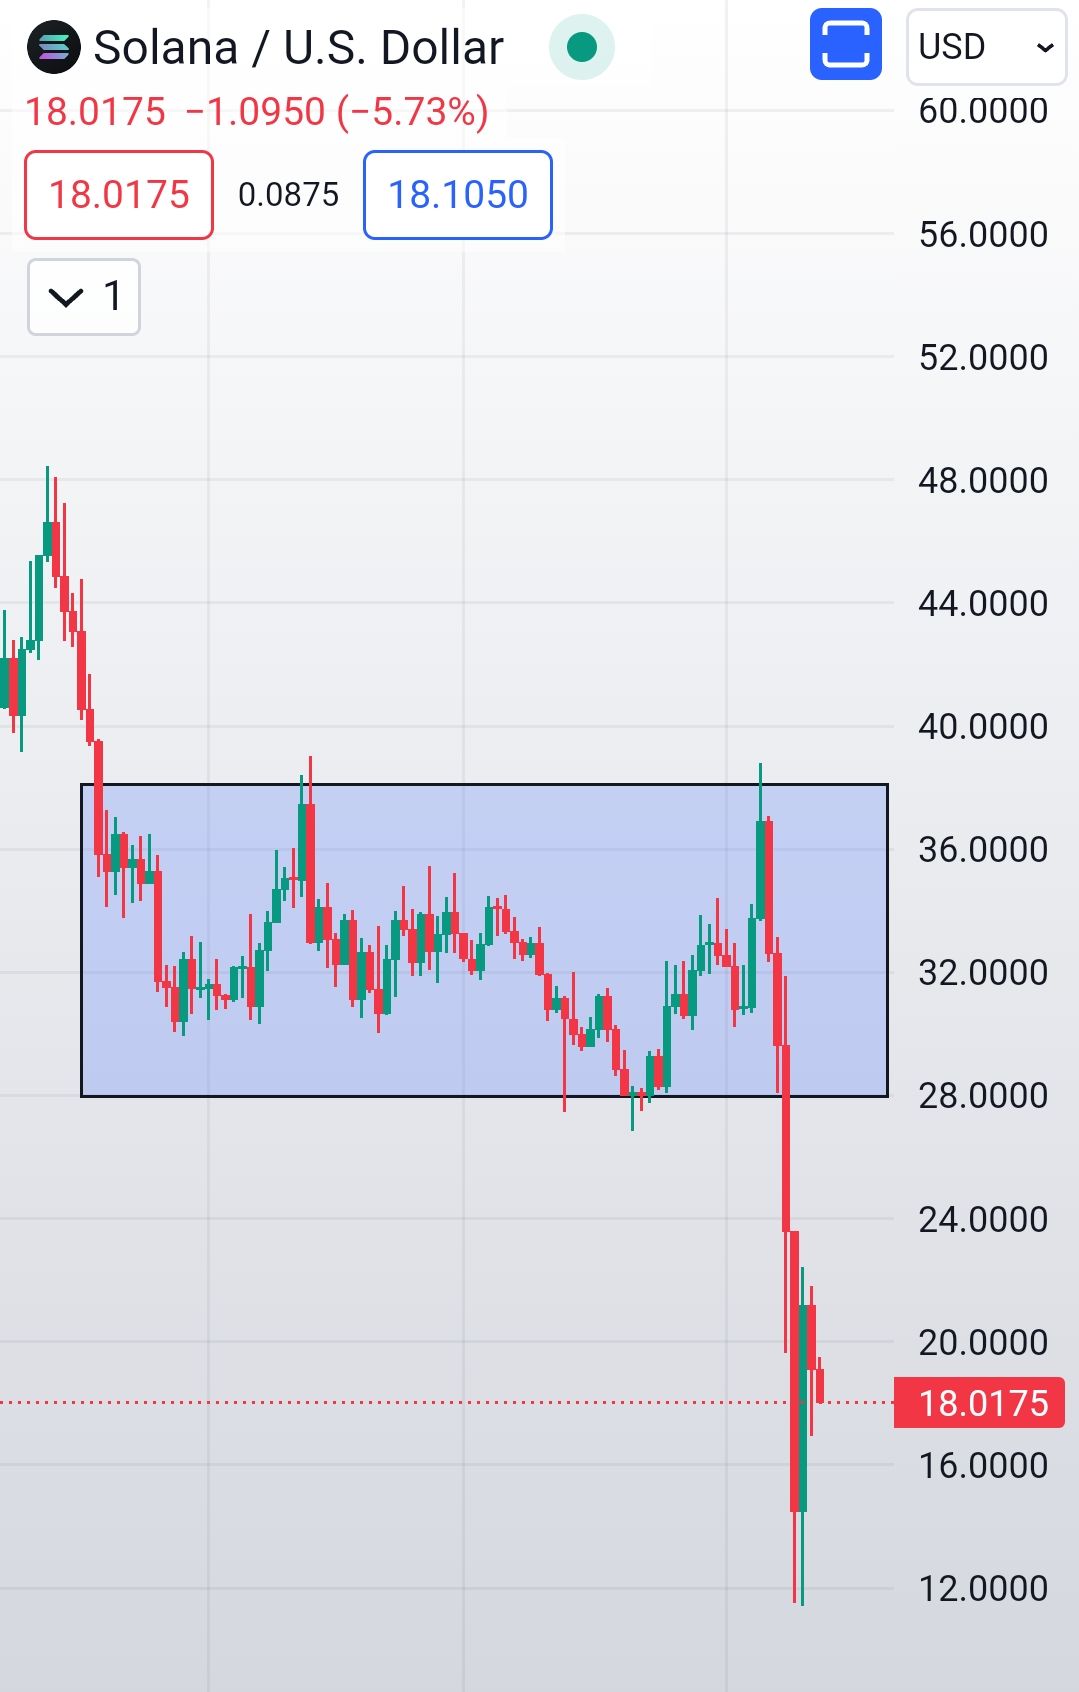
In the daily timeframe, Solana has broken its support level after a period of consolidation. This breach indicates a shift in market sentiment, potentially signaling a bearish trend. Traders and investors should exercise caution and consider risk management strategies, as the breakdown of support levels can lead to further downside potential.
Remember, technical analysis is a guide, not a crystal ball. It provides us with clues and signals, but the market is an unpredictable dance partner. Keep a keen eye on these patterns, and don't forget to factor in the broader market sentiment.
Thank you...