There has been a push for HBD adoption around the globe. Merchants accepting HBD as payment. This especially in places like Venezuela and Cuba. With the HiveFest taking place in Mexico, there are some merchants accepting HBD in Mexico now as well. The recent increase in the crypto prices might add some fuel as well.
How is this affecting on chain activity. We can take a look at the number of transactions and accounts making transfer. If HBD adoption is increasing this should increase as well.
Let’s take a look.
Here we will be looking at:
- Daily/monthly transactions
- Daily/monthly number of accounts transfering HBD
- Daily/monthly HBD value transfered
- Top accounts by number of transactions and value
The period that we will be looking in is starting from the Hive fork back in March 2020 till now.
Number of HBD Transactions
Here is the chart for the data on HBD transactions made per day.
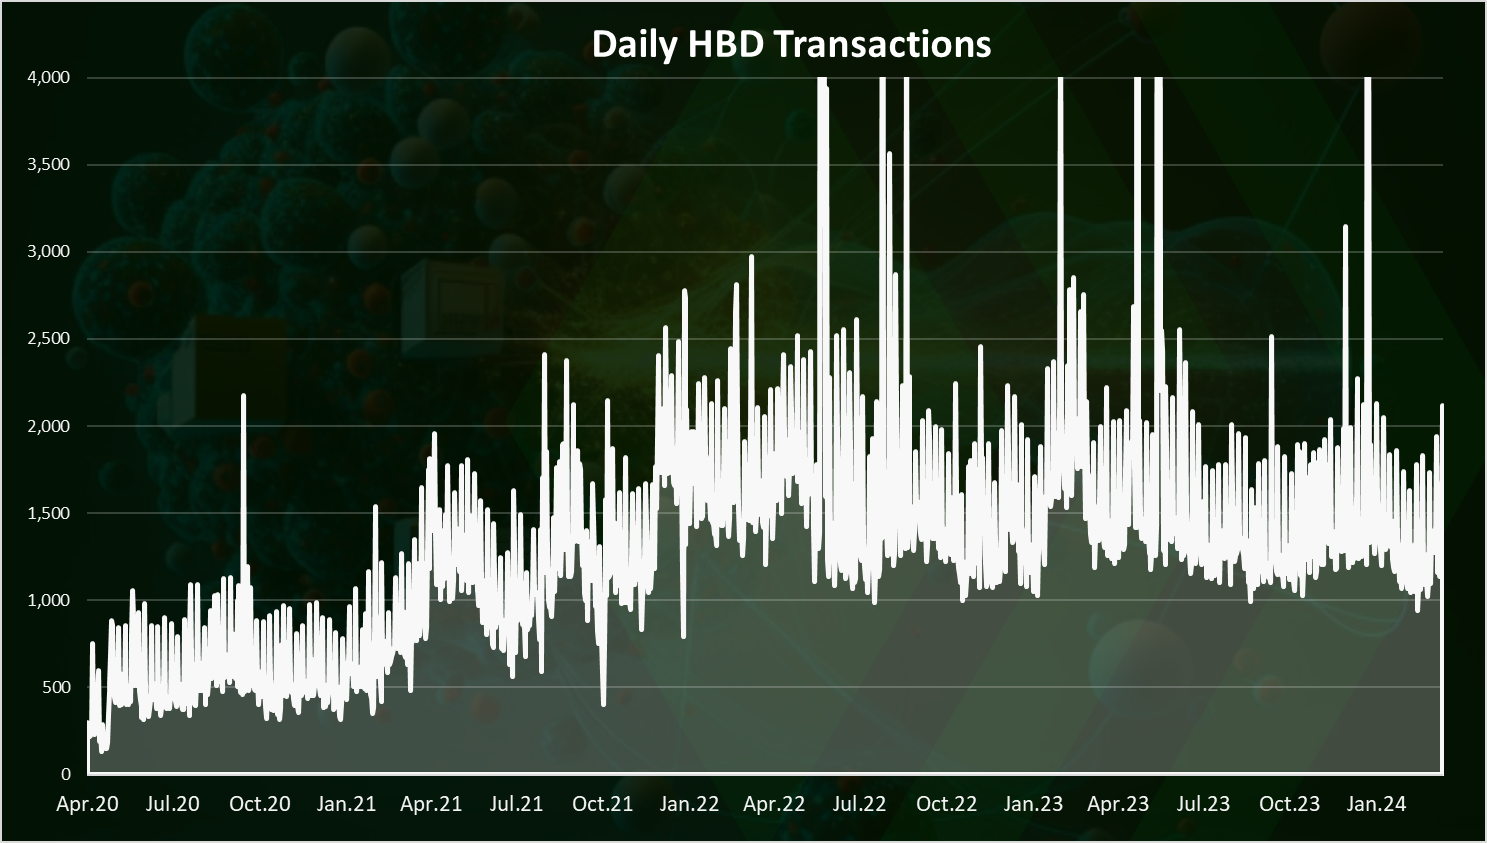
As we can see back in April 2020, this number was low, under 1k HBD daily transactions. It increased since then going up to 3k daily transactions, with occasional spikes up to 10k.
In the last period the number of transactions has been quite steady in the range of 1.5k to 2k daily HBD transactions.
When we plot the data on a monthly level we have this:
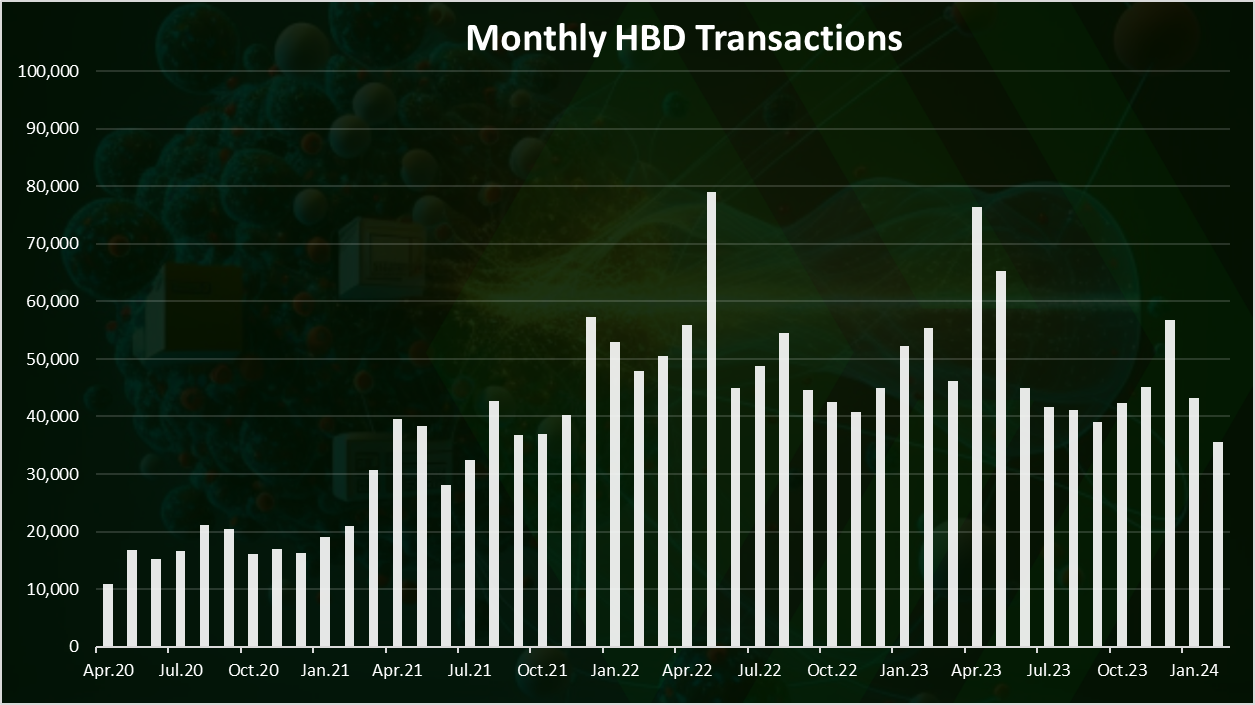
Here we can see an even clearer trend. An uptrend up to 2022, then a period of stagnation. February 2024 has even a drop in the number of transactions but we should have in mind the shorter month as well.
Overall no significant uptake in the number of HBD transactions yet!
In the last months there is around 40k HBD transactions per month, with a spike in January 2024 to almost 60k.
Number of Accounts Transferring HBD
How many users are transferring HBD per day? Here is the chart.
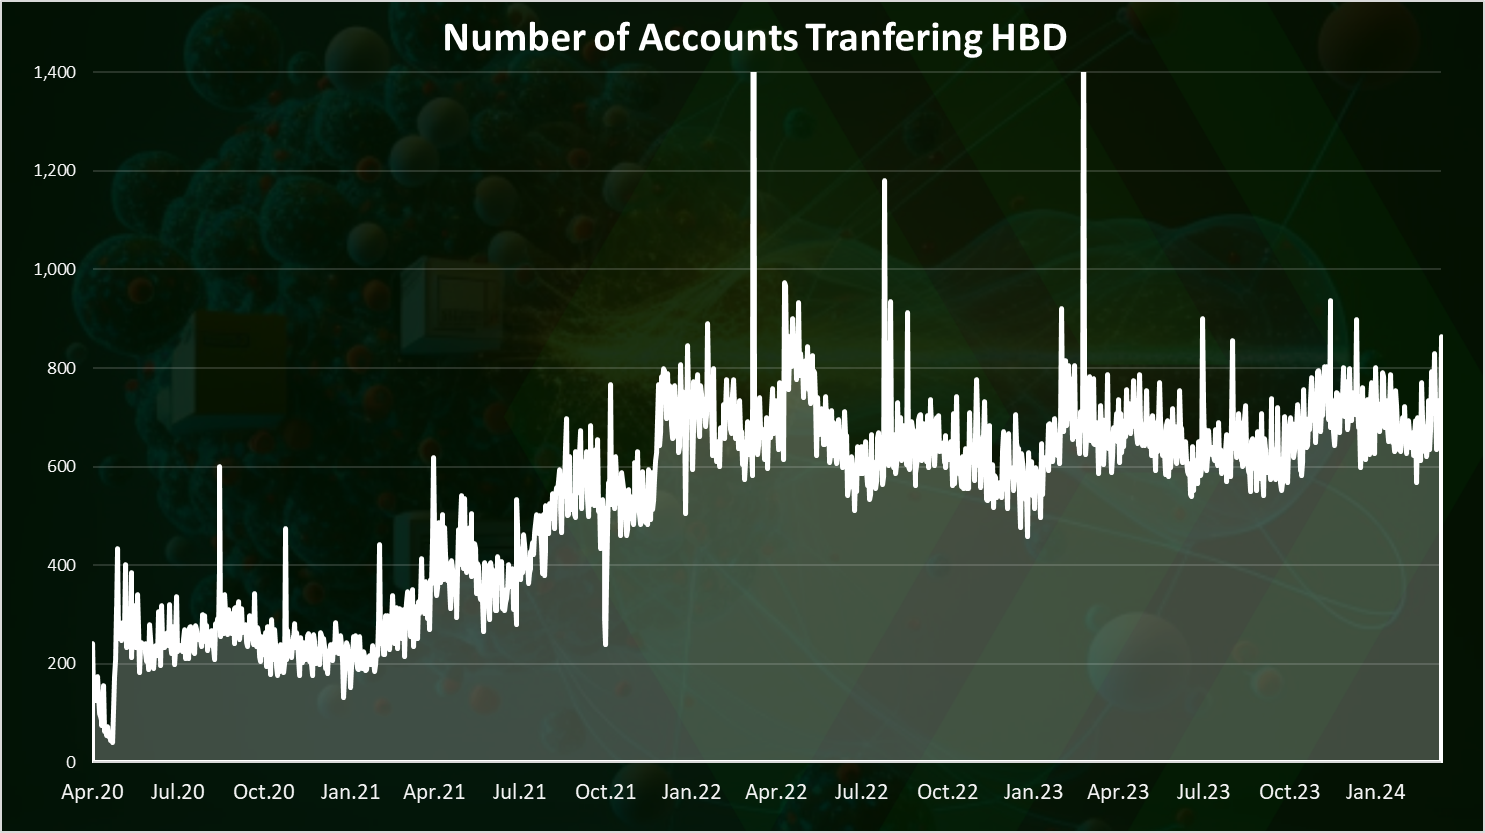
The trend here is similar as for the transactions. At the beginning there is just around 200 DAUs, then the number increased to almost 1k in 2022, and a sort of stagnation since then. We can notice a small uptrend in the last few days, the very end of the chart.
In the last period there is around 800 accounts making HBD transactions per day.
On a monthly level the chart looks like this:
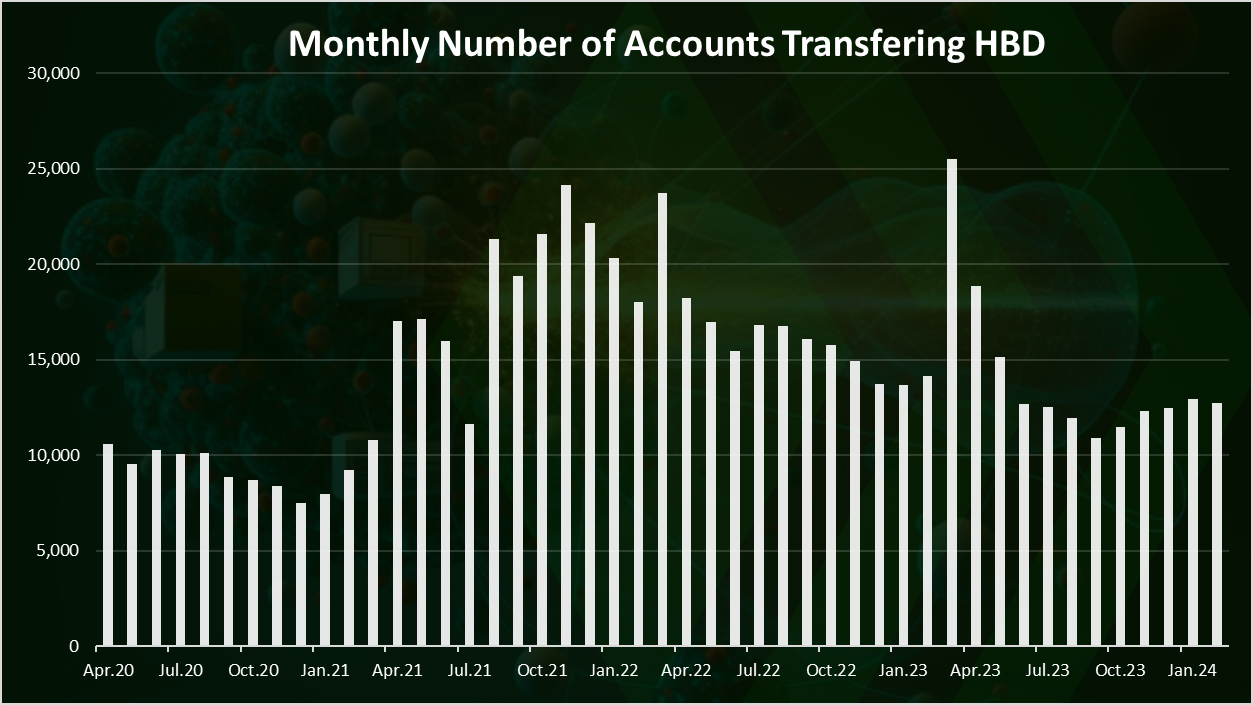
An uptrend towards 2022 and a small downtrend since then.
In the last months the number of HBD MAUs has been almost the same at 12k HBD users monthly.
Transferred HBD Value
What about the amount/value in HBD that has been transferred? Here is the chart for the daily amount of HBD transferred.
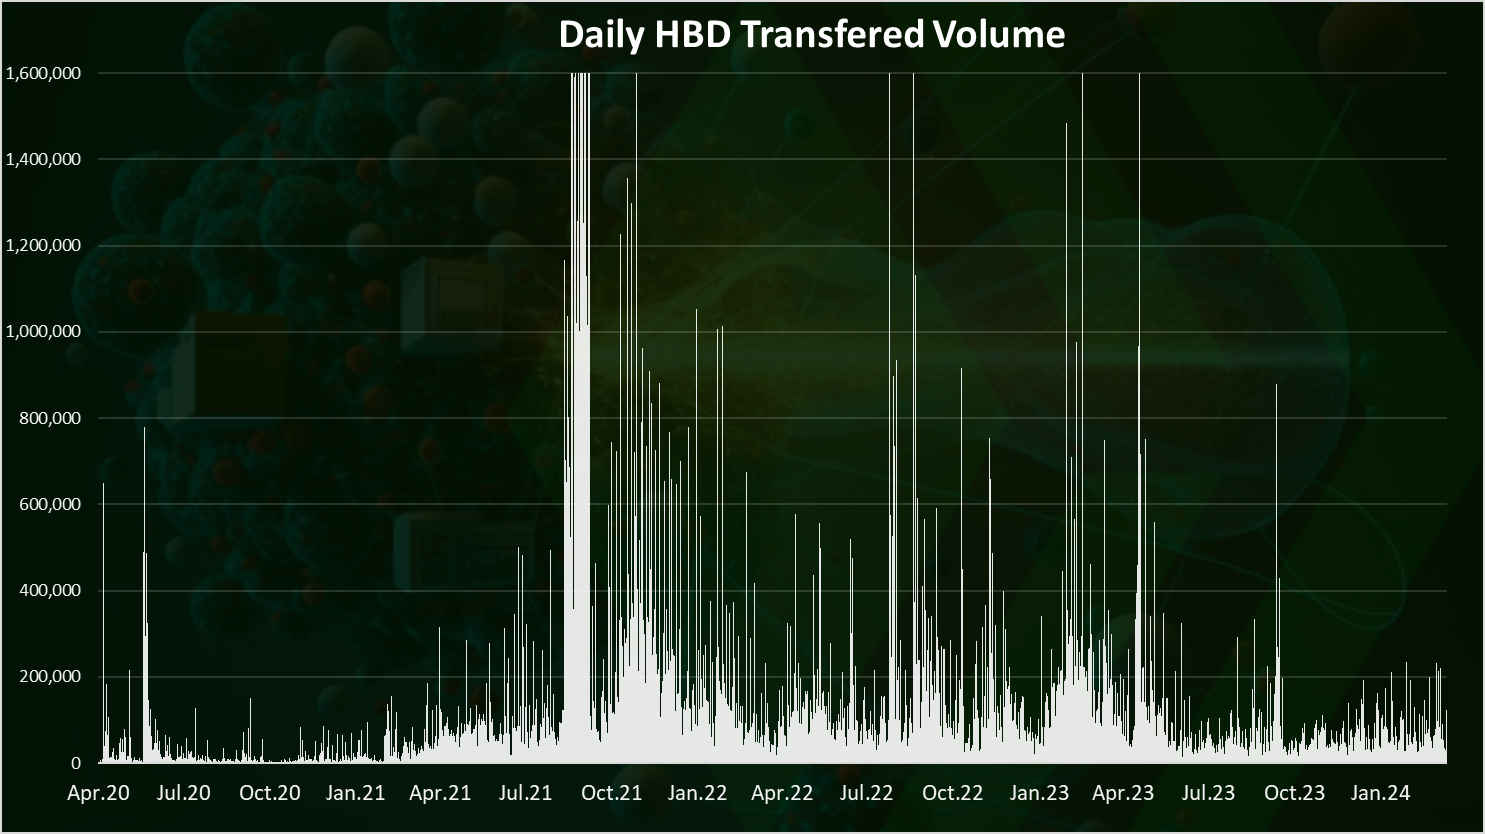
We can clearly see the spike back in August and September of 2021. There was an increase in the HBD value back then and a lot of arbitrages was happening. A few spikes since then to more than a million HBD daily transferred but overall the values are around 100k HBD transferred per day. This is the number for the average daily HBD transferred in the last months as well.
The chart for the monthly HBD transferred looks like this:
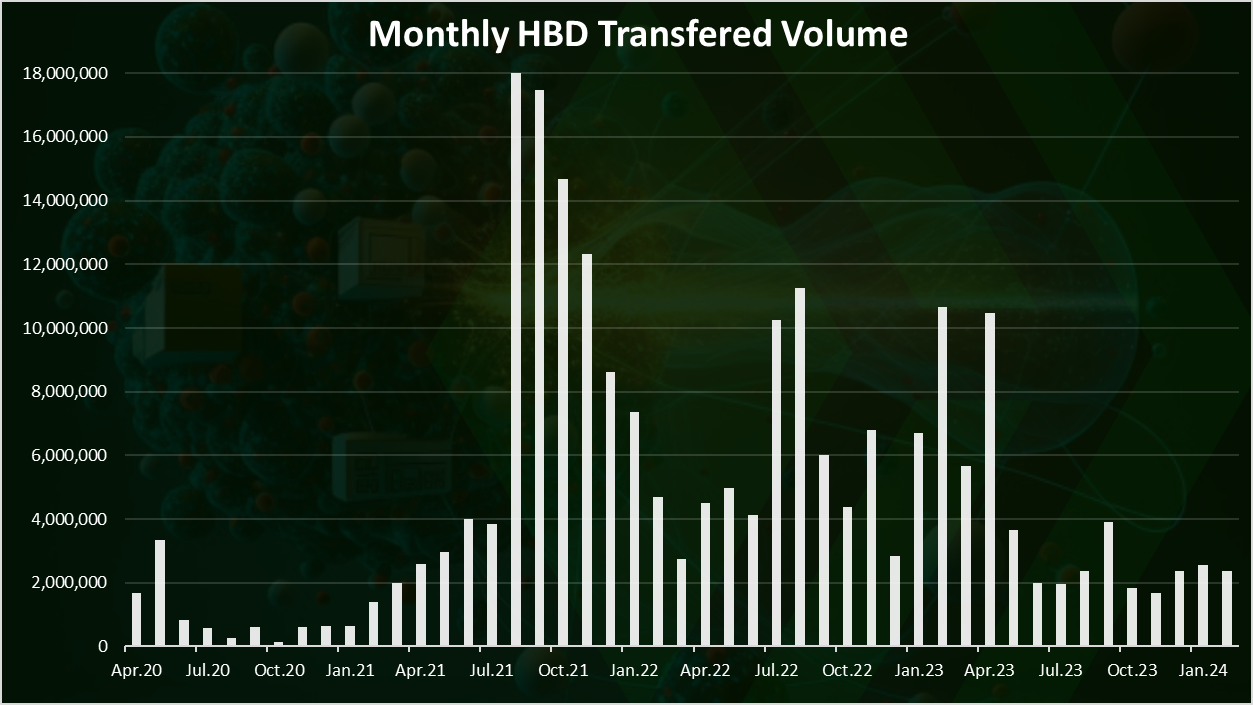
Here again we can see the spikes in August and September 2021. More than 20M HBD was transferred around in August alone and September has been close to 18M.
In the last period there is around 2M HBD volume per month.
Top Accounts
Who is making the most HBD transactions? Here is the chart for the last 30 days.
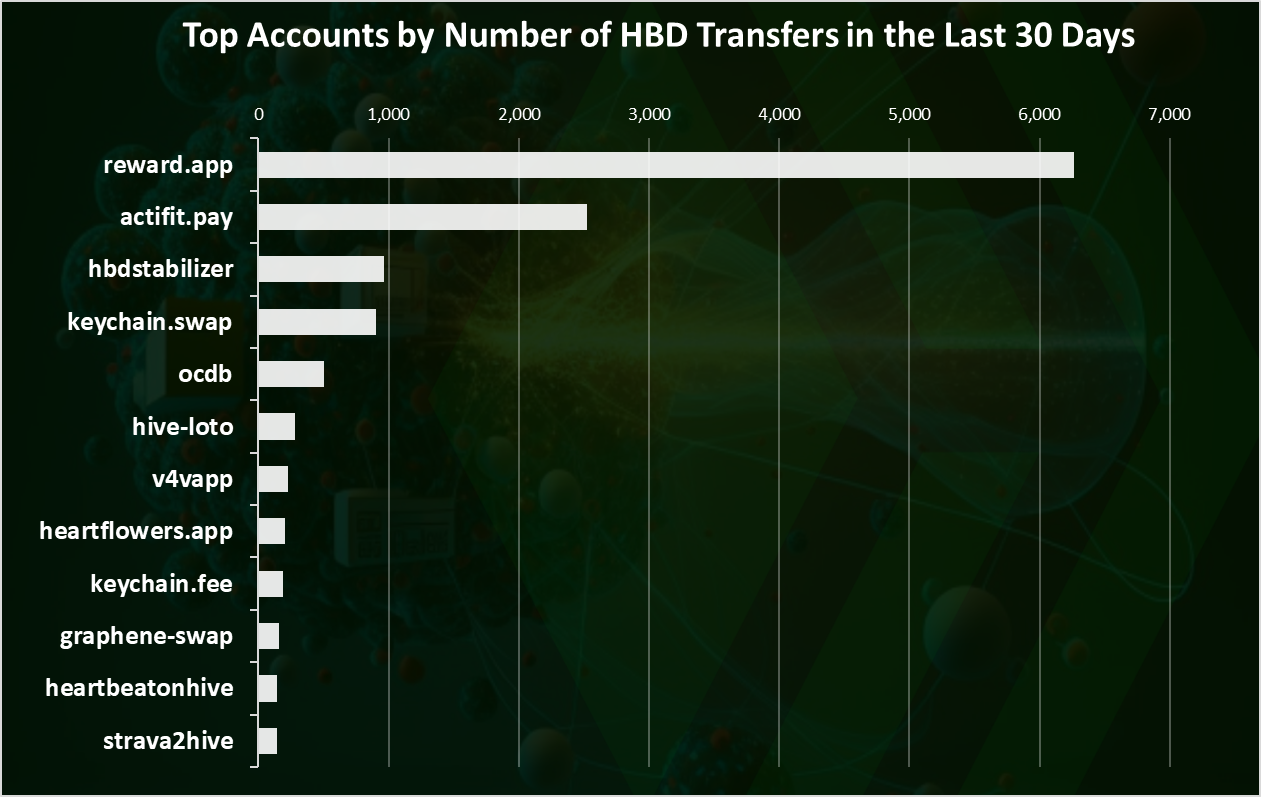
The @reward.app has been making a lot of HBD transactions, or in total of 6.2k operations involving HBD. @actifit.pay is in the second spot, followed by the @hbdstabilizer. Because of the feeless system on Hive, users can make thousands of transactions in HBD without worrying for gas fees.
The above is in terms of the number of operations. What about in terms of value? Users can make a lot of small transactions with HBD, but some can make a fewer transactions but with bigger HBD amounts.
Here is the chart for the top accounts transferring the biggest volume in HBD in the last 30 days:
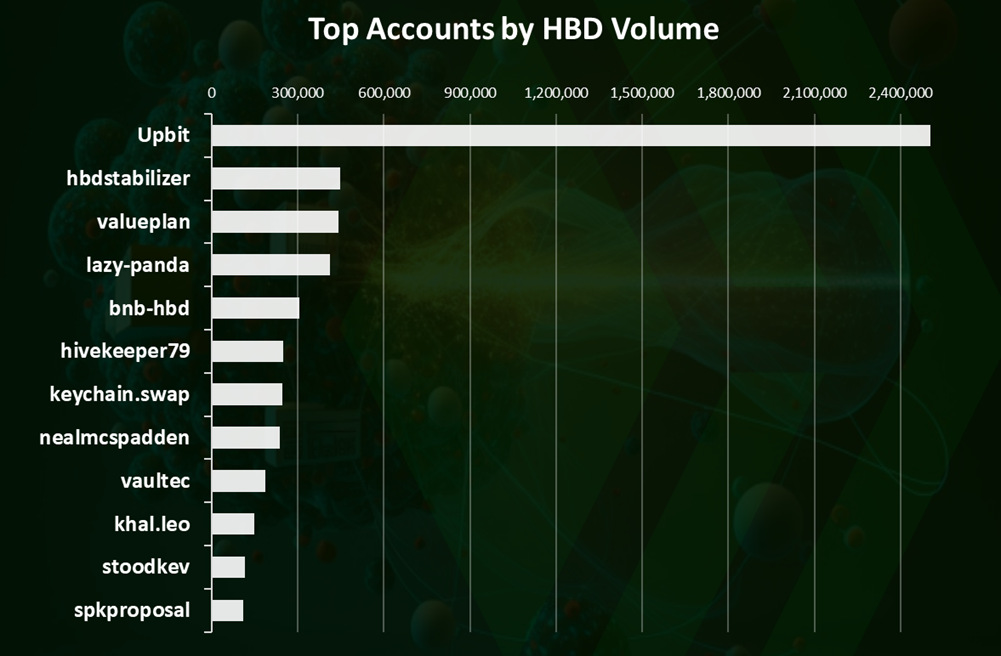
The Upbit exchange comes on the top with more than 2.5M HBD. Note that the exchange has multiple accounts, that I have summarized in one. The @hbdstabilizer comes on the second spot with almost 500k. Some others big accounts in the top making between 100k to 400k HBD volume monthly.
Summary
The overall trend for HBD is a growth in the numbers of transactions and accounts towards 2022, and then a slow decline and stagnation un the last period. While we can notice that the numbers have been steady, we can still draw a positive conclusion having in mind how hard the bear market hit. Having a project that has retain activity and users is a success for such times.
In 2024 on a monthly level around 12k accounts are using HBD, making 40k transactions and transferring around 2.5M HBD in value. The recent increase in prices might push these numbers a lot.
All the best
@dalz