I knew a little hard work would pay off. I went from two downward-trending weeks on X to an upward-trending week just by posting more in the last 7 days.
Curious about what the 28-day and 3-month reports would look like, I decided to look. Not quite as impressive.
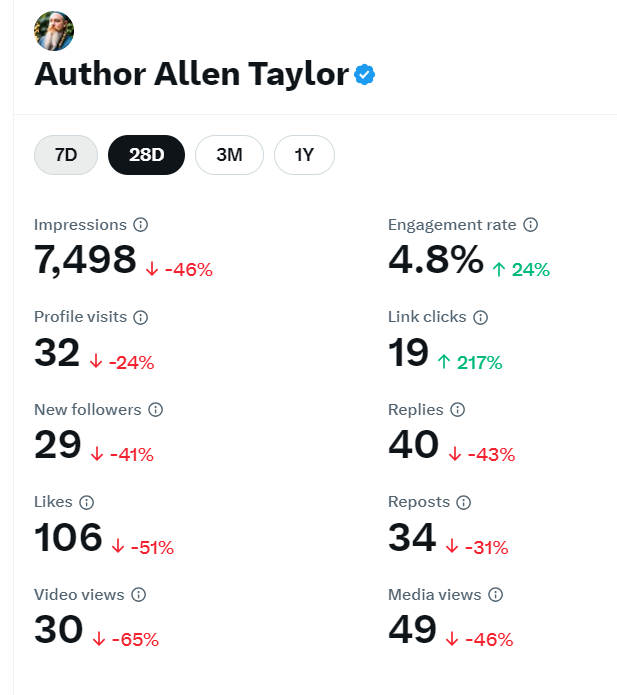
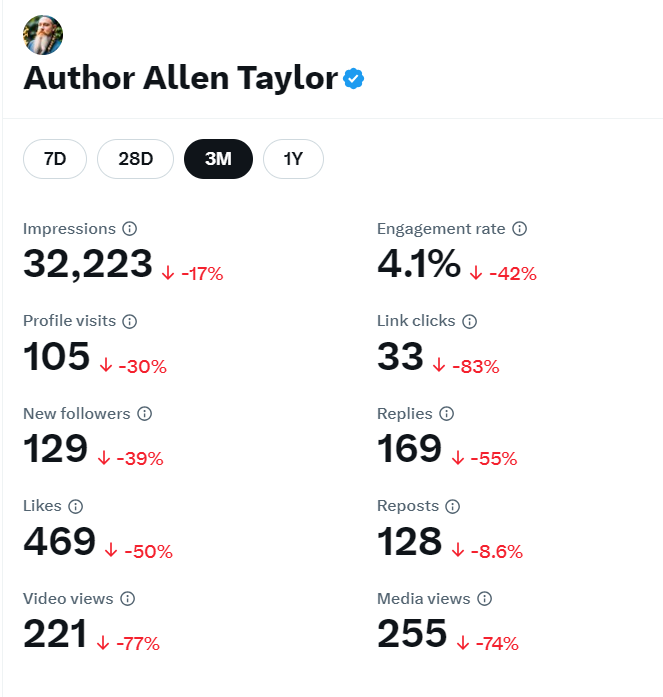
Okay, so it can't all be cherry pops and mocha lattes.
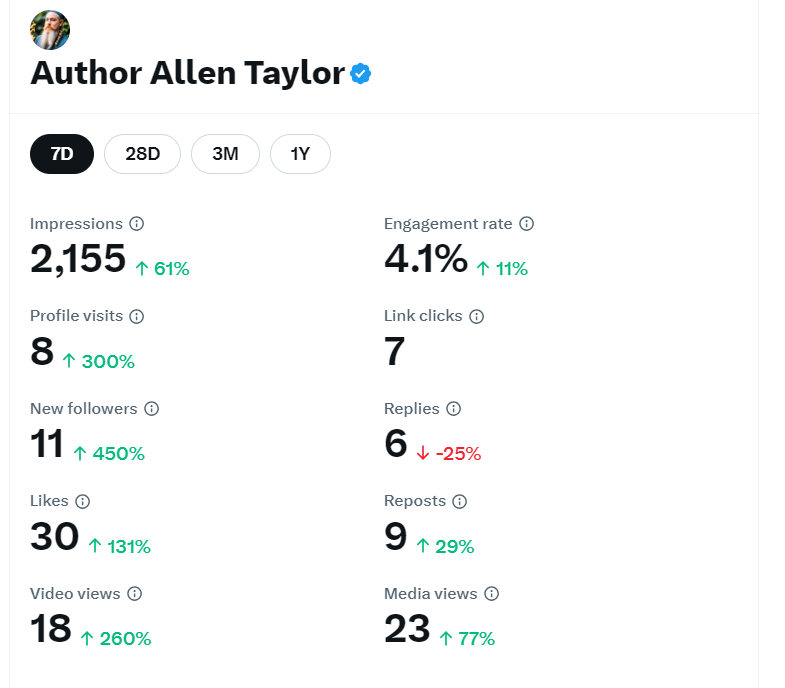
I am satisfied that simply posting a few extra posts in the past week has led to every metric, except one, going up. Impressions increased by 61 percent. Engagement rate went up 11 percent. Profile visits and new followers increased 300 percent and 450 percent, respectively (11 new followers puts me at 414, a new high for this account). Likes and video views increased 131 percent and 260 percent, respectively, while reposts and media views went up 29 percent and 77 percent, respectively. The one lone downer was replies declining 25 percent. I guess you can't have it all.
Now, let's look at the granular metrics.
Impressions and Engagements
Impressions peaked this week on Thursday, May 9 with 590 organic views. The weekly total was 2.1 thousand and the average per day was 295.
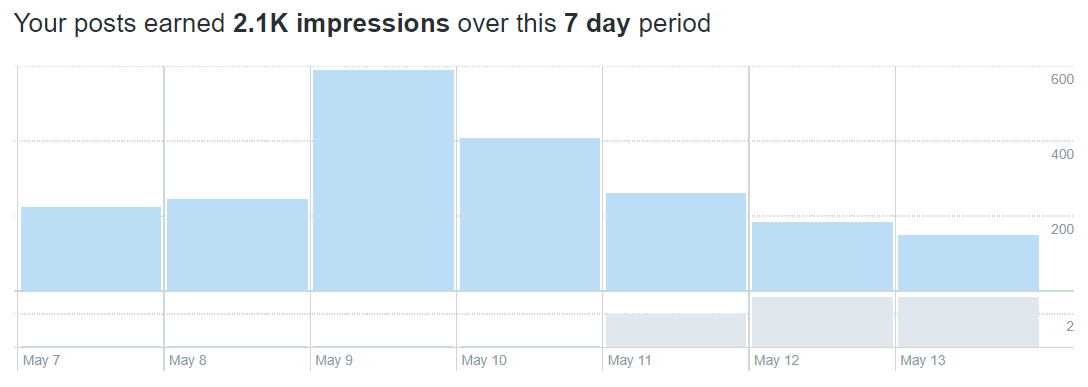
I love the stairstep effect. Besides being telling, it's also aesthetic. Friday, May 10 saw 409 organic impressions. That's almost half my impressions for the week in two days. The rest of the days were below 300 impressions each, but none of them were terrible.
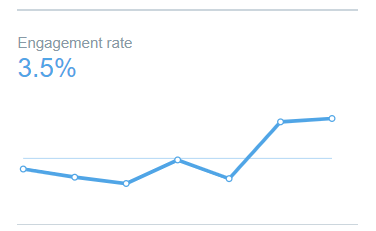
The engagement rate started below 3 percent and went up drastically over the weekend. On Saturday, May 11, it was at 1.9 percent. On Sunday, May 12, it bounced to 6.5 percent and peaked at 6.8 percent this morning, May 13. The week's engagement rate was 3.5 percent. Shout, "Hallelujah!"
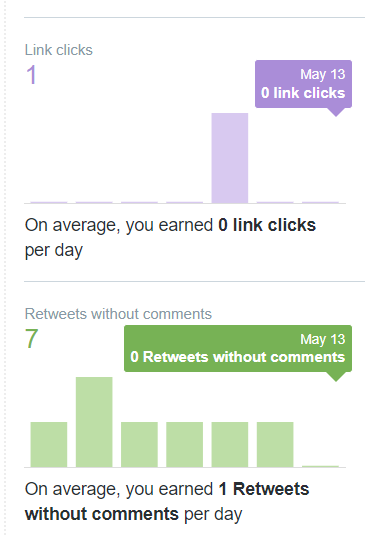
My posts saw just 1 link click all week. However, retweets registered 1-per day on average.
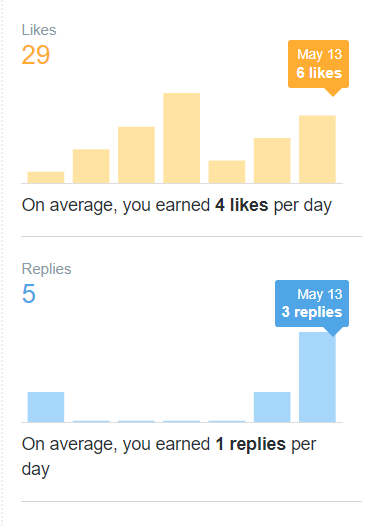
Likes averaged 4 per day while replies averaged 1 per day. Aggregate likes were 29, peaking at 8 on Friday, May 10. My posts had 5 replies this week with 3 of those this morning.
While I posted a bit more this week than I did the previous two weeks, the posts didn't see a lot of engagement. At least, there weren't a lot of comments. There were quite a few likes. That's something, I guess, but I would like to see more interaction on my posts. I guess I need to create more posts that elicit that kind of response.
Now, on to the top posts.
Top Posts
The post with the most impressions this week was a post I repurposed from another X user comparing Web2 properties with Web3 properties. Published on Tuesday, May 7, that post received 87 impressions.
Another post tagging a different user earned 35 impressions. Again, published on May 10, the post compared Web2 with Web3 in a single metric.
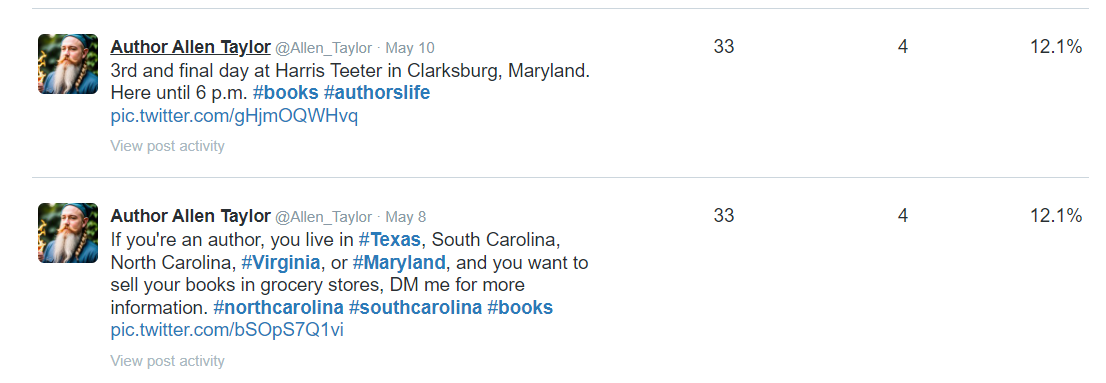
Two posts tied with 33 impressions each. One post, published on May 10, promoted my third day selling books at Harris Teeter (@HarrisTeeter) in Clarksburg, Maryland, and the other post, published May 8, invited other authors to inquire about getting into grocery stores to sell their books.
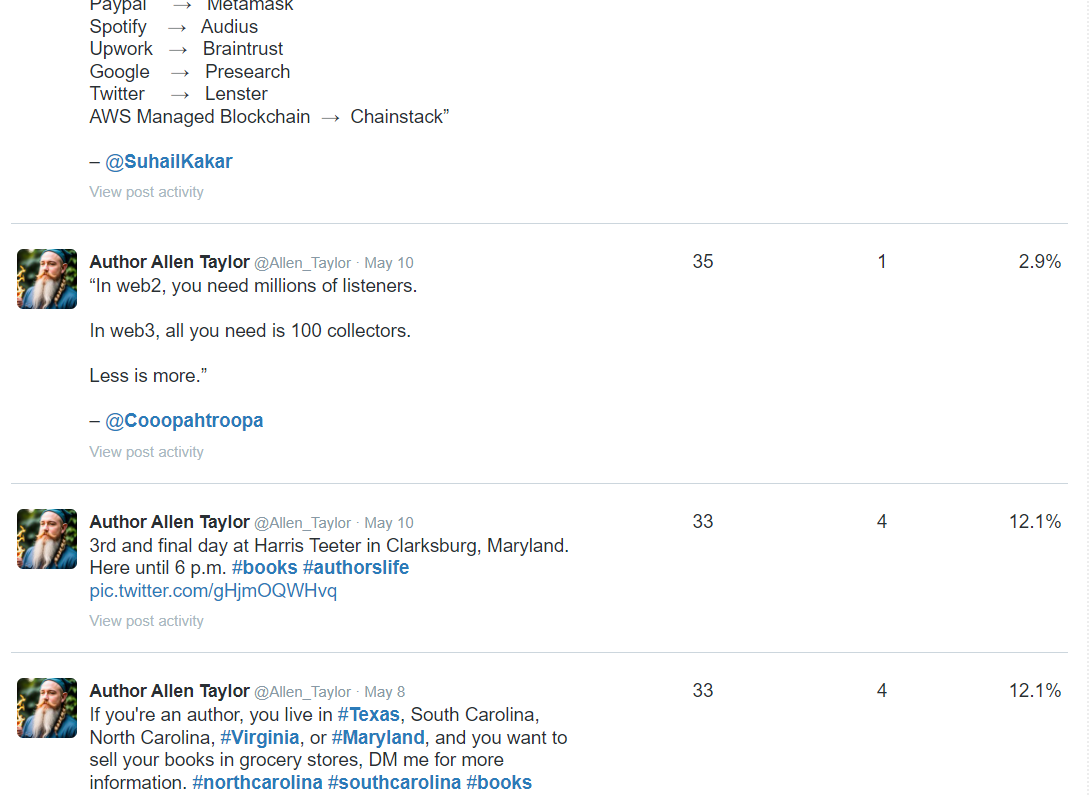
In terms of raw engagements, both posts with 33 impressions had the highest at 4. A post highlighting my second day selling books in Clarksburg, Maryland had 3 raw engagements and was published on Thursday, May 9.
In terms of engagement rate, again, the two posts with 33 impressions tied for first with a 12.1 percent engagement rate. Falling right behind was the post showcasing my second day of selling books in Clarksburg, Maryland and that post had an engagement rate of 11.5 percent.
The overall top post for this week was a tie. Both posts with 33 impressions achieved the highest status in two categories and third place in one. Let's call that a win-win.
Posted Using InLeo Alpha