The pattern on the weekly chart of RUNE is interesting at the moment. The potential of a head and shoulders top exists. The left shoulder and head are already present.
The price action over the next few weeks has become something worth watching.
RUNE/USD Weekly Chart Analysis
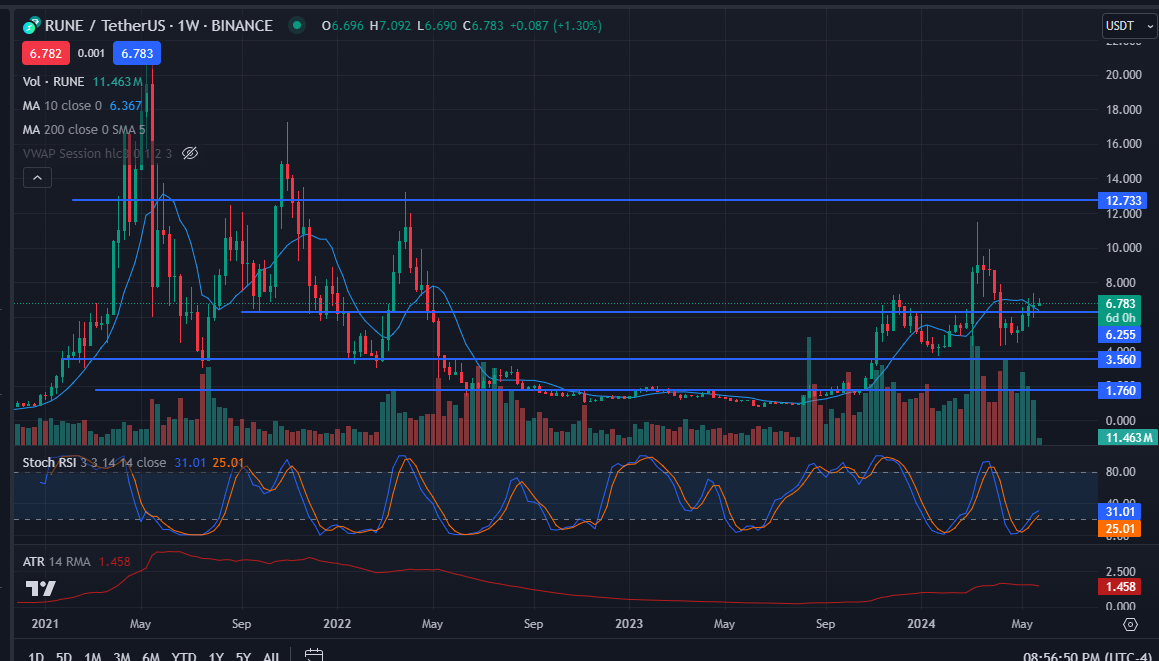
The chart does show strong support around $6.22 though, which aligns with the 50-week moving average. Staying above this level is key to avoid the head and shoulders confirmation.
Potential Price Moves:
If the entire cryptocurrency market experiences a bullish rally, RUNE could potentially break above $8, the most recent swing top area and push toward $10 again.
Posted Using InLeo Alpha